Photo: Media library www.Mittelplate.de. Oil platform Mittelplate.
Energy
J. Baer & G. Nehls
Published 2017
1. Introduction
The Quality Status Reports of 2005 and 2009 (Nehls & Witte, 2009 (QSR 2009)) provided detailed overview on the exploration and exploitation of gas and oil in the Wadden Sea Area. As a follow up, this report is a short overview on the present status and focuses on major new developments since 2009.
Regarding wind energy, the Wadden Sea Conservation Area is excluded from wind farm development. This has been postulated in the Danish Statutory Order, the German National Parks Acts and the Dutch Conservation Area (PKB Area). However, the construction of wind farms in the adjacent sea areas has rapidly increased in the past years and the associated cable laying activities and the cable connections to the mainland itself also affect the Wadden Sea area directly. The second part of the report provides an overview on the developments in the wind energy sector since 2009 and the long-term governmental planning.
2. Status and trends
2.1 Gas and oil
The Netherlands
The Netherlands is the largest producer of natural gas in the European Union. The Groningen field is amongst the ten largest gas fields in the world and there are hundreds of small gas fields in the subsurface of the Netherlands. As a result almost every household uses natural gas, whereas oil reserves are limited, despite the 44 discovered fields to date. There is currently no oil extraction in the Dutch Wadden Sea.
Drilling for gas in the Wadden Sea conservation area is prohibited and therefore has to take place from the shore with directional drilling using deviated wells, tapping into the gas reserves underneath the Wadden Sea. There are currently six active gas fields within the Wadden Sea Conservation Zone: Nes, Lauwersoog, Moddergat, Blija-Ferwerderadeel, Zuidwal and Ameland-Oost (Figure 1). Total gas production peaked in 2013, with 2554 million m3 gas extracted (Figure 2). The Groningen gas field also partially extends underneath the Wadden Sea. Lauwersoog, as the most recent gas field, started production in October 2008. Further gas fields that are currently explored in the Dutch Wadden Sea are Ternaard, Terschelling and Schiermonnikoog (Figure 1). These new explorations or exploitations will not lead to any installations within the property and will be land or island based or in case of the fields north of the islands will not reach underneath the Wadden Sea.
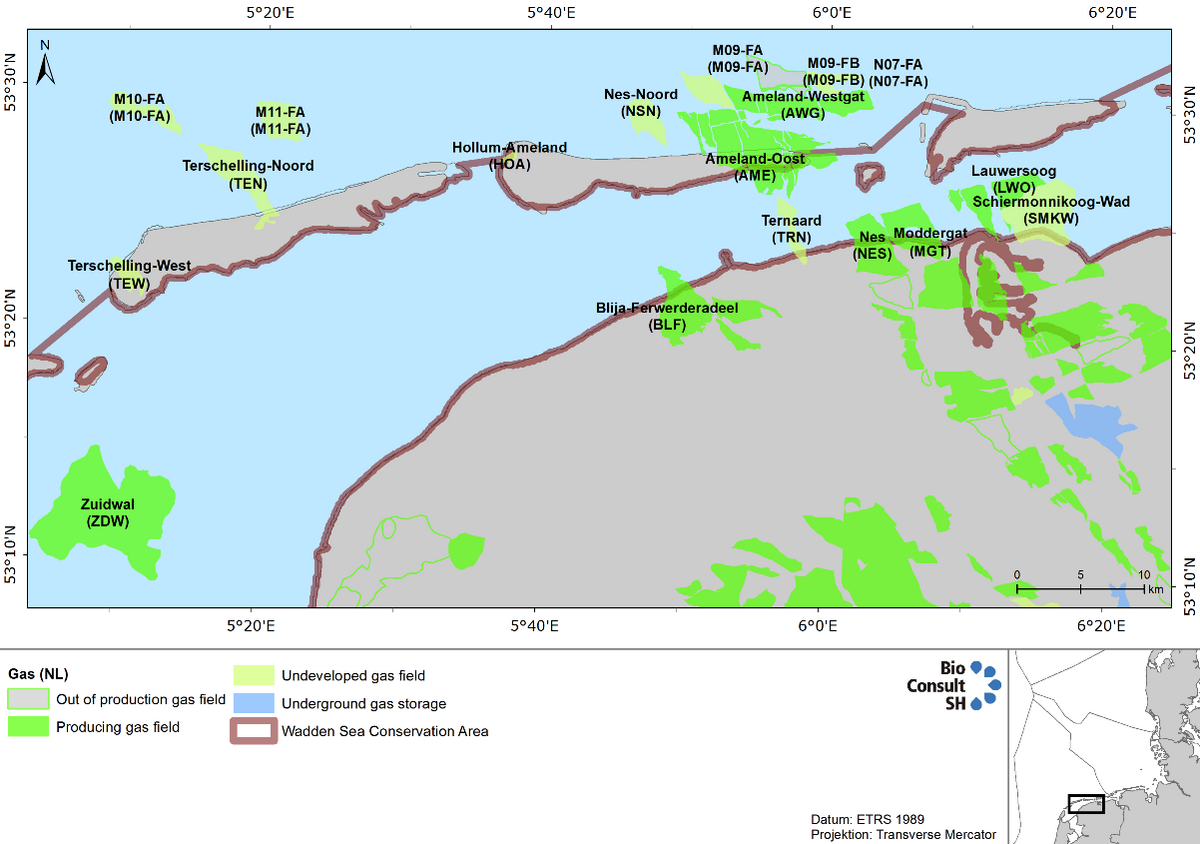 Figure 1. Producing and planned gas fields in the Dutch Wadden Sea (Source: www.nlog.nl).
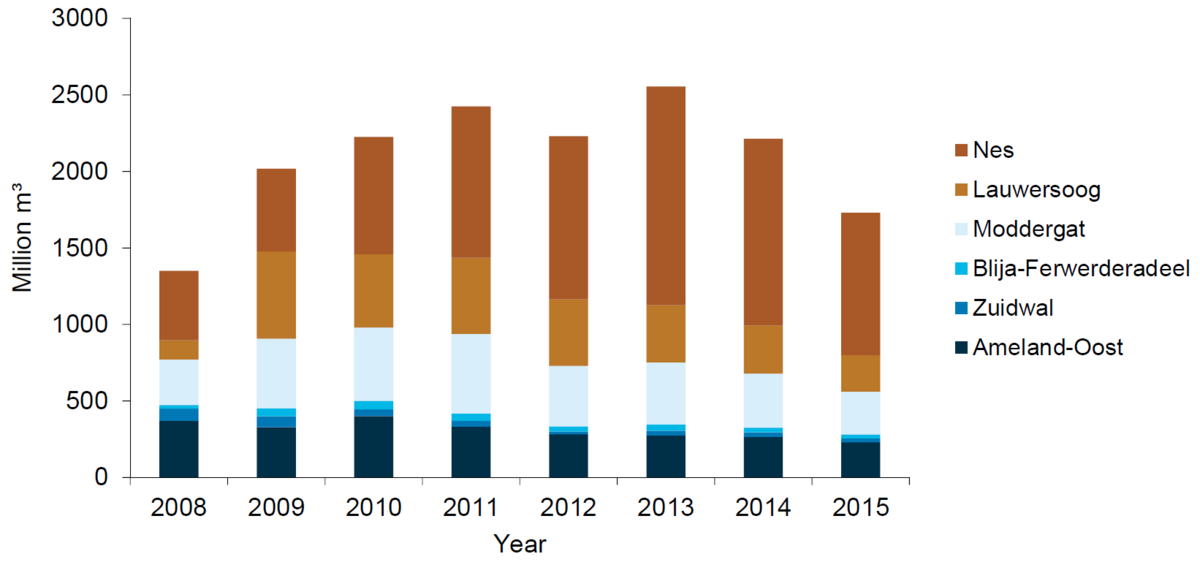 Figure 2. Gas production on the Dutch Wadden Sea 2008-2015 (in million m3) (Source: NL Oile- en Gasportaal).
Subsidence
There are more than a hundred producing mining projects in the Netherlands, some of which have resulted in ground surface subsidence. The big gas fields underneath the sea floor might lead to subsidence effects, particularly problematic in sensitive areas like the Wadden Sea, as its existence depends on the ability to adjust to changing sea levels. However, modelling the rate of subsistence in a dynamic environment like the Wadden Sea is very complex, taking into account predicted sea-level rise and sediment displacement. Onshore continuous GPS stations are installed near subsidence bowl centres to monitor subsidence rates and serving as an early warning system. In the Wadden Sea, buried benchmarks have been installed on which GPS antenna can be mounted temporarily during measurement campaigns.
With a partial extension of its field underneath the Wadden Sea, the Ameland gas field, situated below the island of Ameland is one of the oldest and has been producing since 1986. The production has caused up to 35 cm of subsidence in 2011 and the prognosis for 2015 indicates a maximum subsidence of 42 cm in the area underneath the island (van Thienen-Visser & Breunese, 2015). Since 1990 the subsidence caused by the depletion of the Ameland gas field is compensated by sand suppletion (Schoemann, 2006). Due to the sensitive nature of operations in tidal areas, gas fields such as Ameland, Nes, Moddergat, Lauwersoog, and Vierhuizen are being exploited within the so-called “effective subsidence capacity” (ESC). The ESC is determined by the difference between the maximum sedimentation rate a tidal basin can cope with, and the rate of relative sea-level rise in combination with land subsidence. Gas production is adjusted or halted, an approach known as ‘hand on tap’, if there are signs that the subsidence capacity and six years average expectation values of ESC rates will be exceeded now or in the future. So far the application of this mechanism has not been reported. For more details on subsidence management and modelling in the Wadden Sea see also de Waal et al. (2012).
Germany
Lower Saxony
Currently there is no exploitation of natural gas in the Lower Saxony Wadden Sea area. The two mining fields that existed since the 1970s, Manslagt Z1 and Leybucht Z1, have ceased production in 2007 and 2008, respectively. Originally the GDF Suez E&P Deutschland GmbH planned to exploit the last reserves of the existing borehole in Leybucht Z1 and was granted permission until 2023 by the State Office for Mining, Energy and Geology. However, further exploration did not turn out to be economically viable and the borehole was filled in 2012.
Hamburg
According to the Act of the Hamburg Wadden Sea National Park, the exploitation of energy resources in the Hamburg Wadden Sea area is not allowed.
Schleswig-Holstein
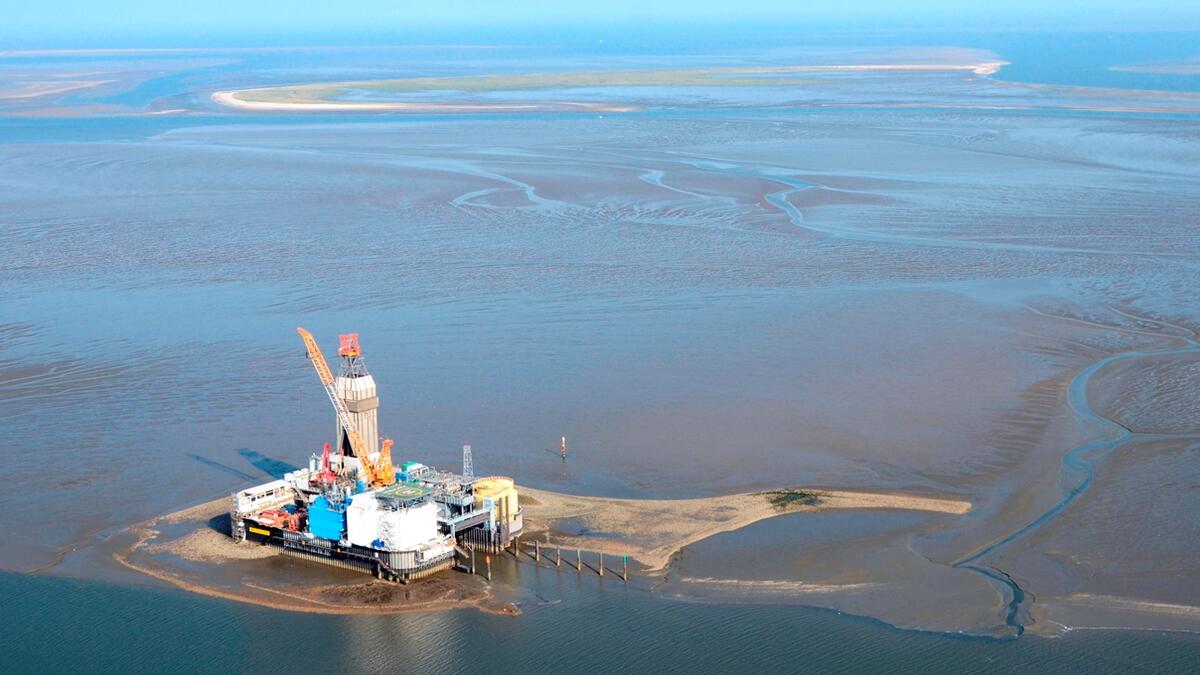
There is no natural gas exploitation in the Schleswig-Holstein Wadden Sea, but Mittelplate 1, Germany’s largest oil field, is situated within the core zone of the National Park of Schleswig-Holstein (Figure 3). The field was discovered in the Dogger sandstone in 1981 with confirmed reserves of 75 million tons. The oil is located in pores of the sandstone layers at depths of between 2,000 to 3,000m. The Mittelplate facilities went into production in 1987 from an artificial drilling and production island, which was built 7 km off the coast. The 70 x 95-metre island was designed as a liquid-retarding steel-and-concrete basin on the sand flats, protected by 11m-high sheet piling. The reservoir is exploited by 18 wells - some horizontal or deviated - of up to 3,000m depth, tapping the oil-bearing sandstone layers. The development is run by a consortium, consisting of Deutsche Erdöl AG (sold by RWE to the Russian investment fund LetterOne in 2015) as the operating company and Wintershall Holding GmbH.
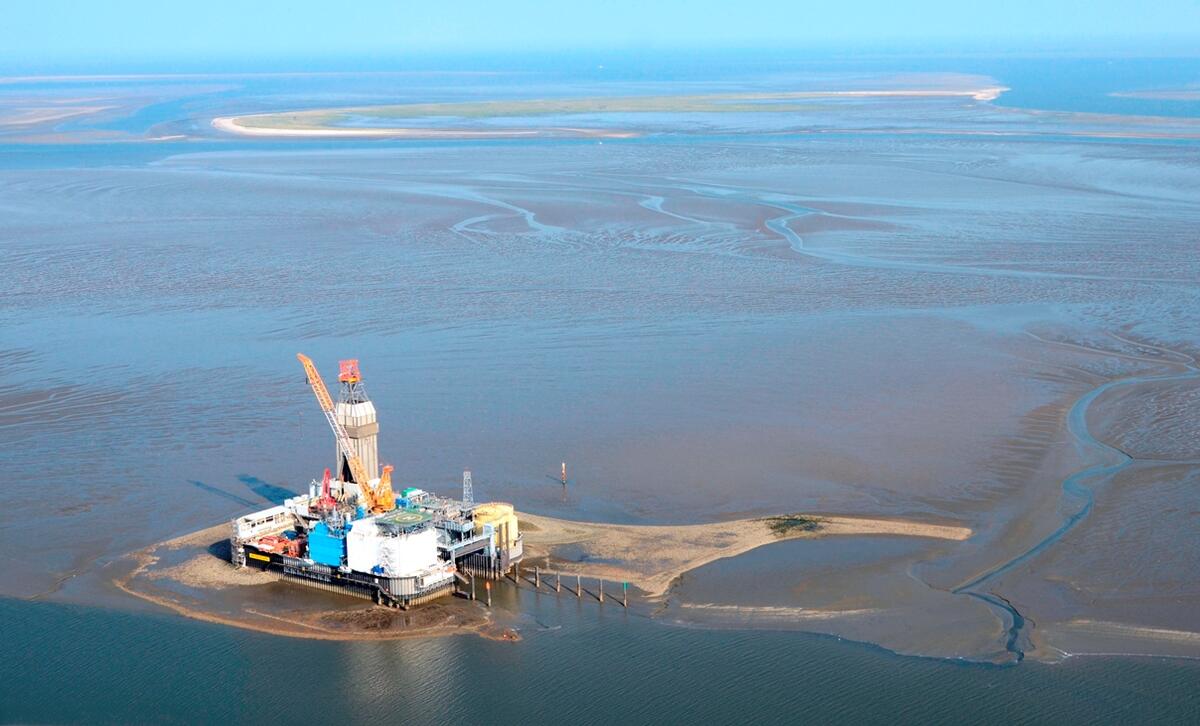 Figure 3. Oil platform Mittelplate, with Trischen Island, Nationalpark Schleswig-Holstein, in the background (photo: media library www.Mittelplate.de).
In 2000 a land-based facility at Dieksand was established. From here, 2,000 m to 3,000 m-long extended-reach production wells tap into the eastern part of the deposit. This integrated offshore and onshore development has contributed to the more rapid exploitation of the oil field. One 7.5 km stainless steel pipeline was laid from Friedrichskoog-Spitze through the mudflats off the coast and the Marner Plate to Mittelplate Island. Since 2005, oil is therefore no longer transferred by ship, but has been pumped through the pipeline from Mittelplate to the processing facilities of the Dieksand Land Station, which increased the overall safety of the oil transport.
So far 30 million tons of oil have been produced from the Mittelplate oil field, a further 20 to 25 million tons are estimated as being technically and economically recoverable. While the production rate at the beginning of the extraction was around 200,000 tons of oil per year, production increased and peaked in 2003 with two million tons. After this, production rates began to decline due to the natural depletion of the reservoir and ranged between 1.3 and 1.5 million tons in the past years (Figure 4). Over 2,700 t of oil are now transported ashore every day. So far the overall high safety and environmental standards have paid off and no negative side effects to the surrounding areas have been reported.
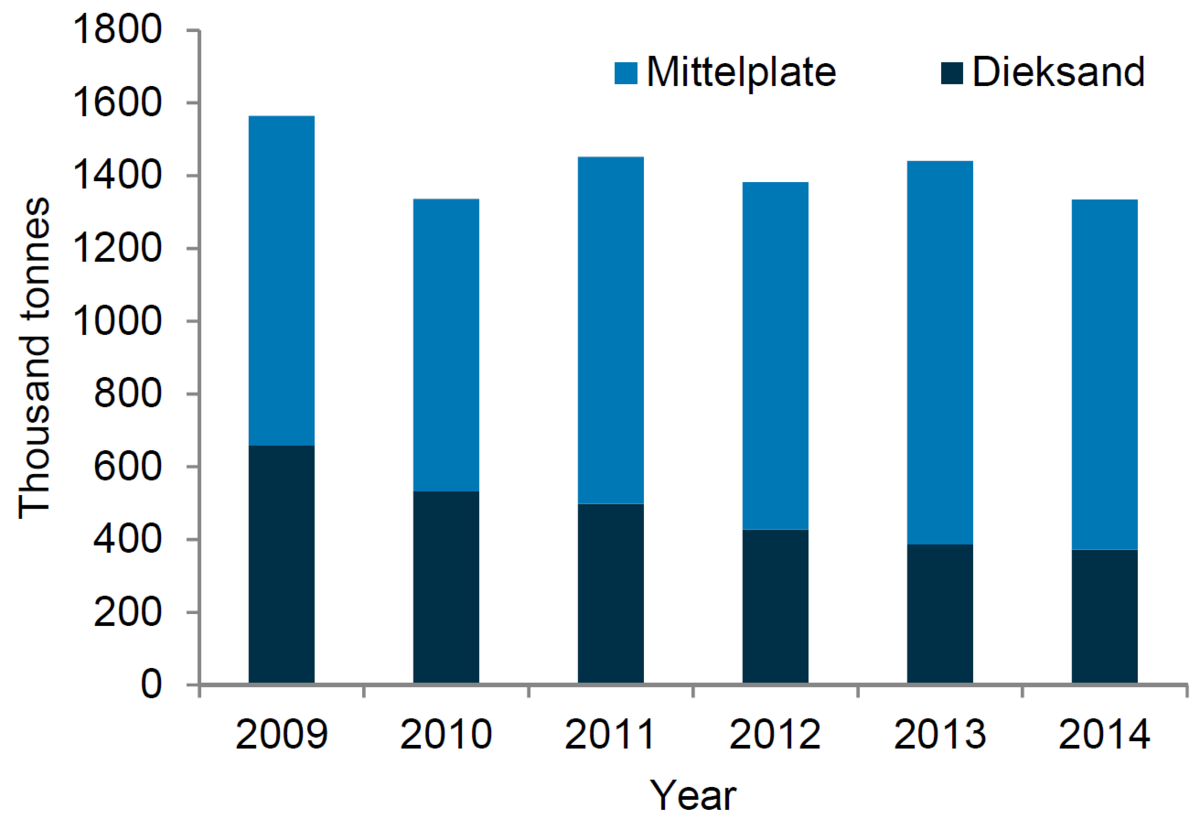 Figure 4. Oil production 2009-2014 at the offshore platform Mittelplate and the mainland facility Dieksand.
Denmark
According to the Statutory Order on the Nature Reserve Wadden Sea, exploitation of gas and oil in the Danish part of the Conservation Area is prohibited.
2.2 Wind energy
In 2015 a capacity of 3,018.5 MW of new offshore wind power was supplied to the grid in Europe, an increase of 108.3 % compared to 2014 and the biggest annual addition to capacity to date (European Wind Energy Association, 2016). A total of 22 offshore wind farms were under construction in Europe during 2015. Of these, 13 were located in German waters, three in the Netherlands, five in the UK and one in Sweden. 75.4 % of the total net capacity brought online originated from Germany (2,282.4 MW), a four-fold increase in its grid-connected capacity compared to 2014. This was mainly due to the delay in grid connections finally established in 2015 in Germany. The second largest market was the UK (566.1 MW, or 18.7 % share), followed by the Netherlands (180 MW, or 5.9 % share). From a total of 3,018.5 MW provided in European waters, 86.1 % were in the North Sea, 9.2 % in the Baltic Sea, and 4.7 % in the Irish Sea. Figure 5 shows the current state of offshore wind-farm developments for the Netherlands, Denmark and Germany.
Since the adoption of the Renewable Energy Sources Act (RES-Act), in force since 1 April 2000 and its revision in 2014, the German government aims to cover 6,500 megawatt power generation from renewable energy before 2020 and 15,000 megawatt by 2030. The long term plan is to generate 40-45 % of all energy from renewable sources by 2025 and even 55-60 % before 2035. In 2015 30 % of the generated energy was covered by renewables, nearly half of it was covered by offshore wind-farm power.
The Dutch government aims to promote energy conservation and renewable energy. Under its Energy Agreement for Sustainable Growth, the Dutch government has set a target of 14 % of all energy to be generated from renewable sources by 2020, rising to 16 % by 2023. The aim is to make the Netherlands less dependent from fossil fuel like coal, oil and gas, while securing the country’s energy supply and keeping energy costs on a moderate level.
Today, more than 40 % of Denmark’s energy supply derives from wind power and it is planned to reach 50 % by 2020, as stated in the 2012 Energy Act. Denmark is intending to be independent from fossil fuels by 2050 with wind energy making up a very large proportion of the energy mix by then. The total wind energy capacity in Denmark was 4,890 MW by the end of 2014, 3,620 MW from onshore sources and 1,271 MW offshore. Having built more offshore wind farms than any other companies in the world, DONG Energy is a major player in Europe’s offshore wind industry. More than one-third of the total offshore wind capacity is built by the Danish utility company and it aims is to quadruple the installed capacity by 2020, compared to 2012.
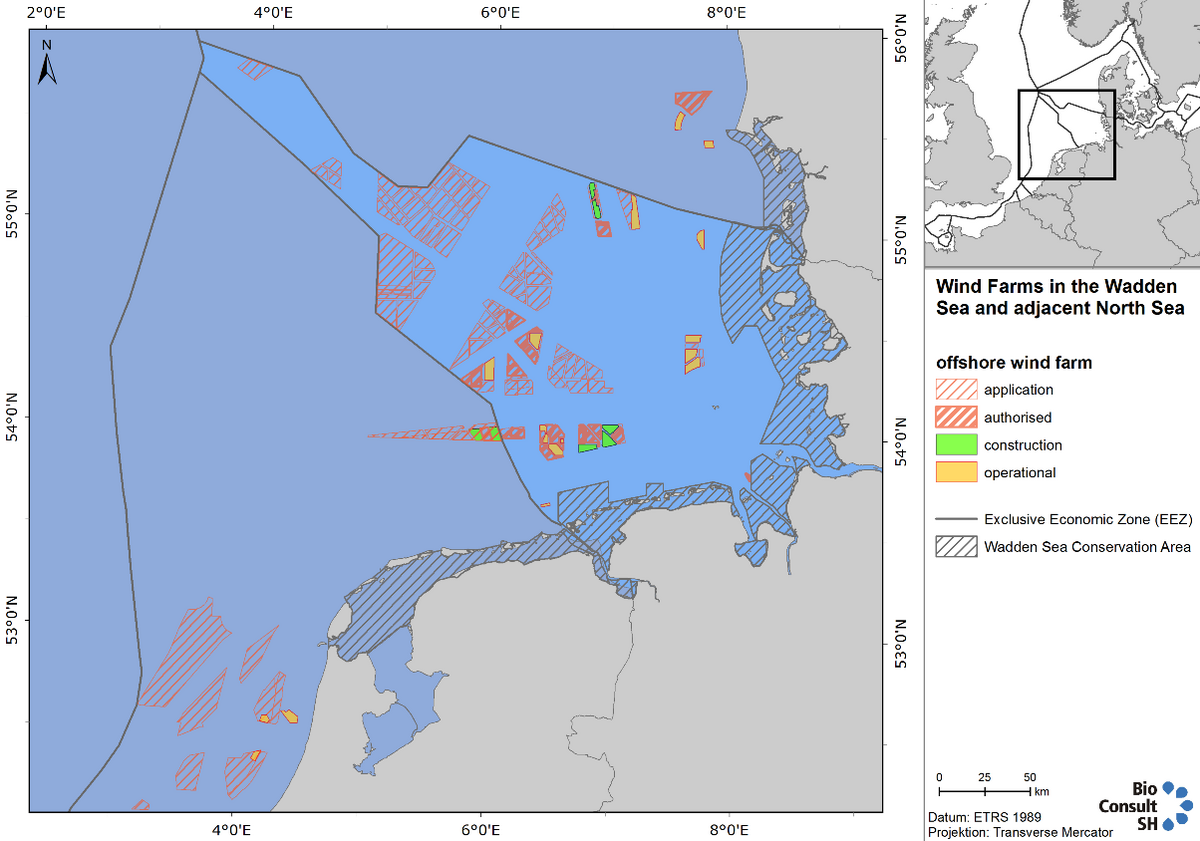 Figure 5. Overview of wind farm developments in Denmark, Germany and the Netherlands, 2016. For detailed information on each wind farm visit www.4coffshore.com.
The Netherlands
The Netherlands’ existing offshore wind farms, and those currently under construction, have a combined capacity of approximately 1,000 MW. The first four off shore wind farms built in the North Sea are Egmond aan Zee (108 MW, 2006), Princess Amalia (120 MW, 2008), Eneco Luchterduinen (129 MW, 2015) and the 600 MW Gemini wind farm, which is the closest to the Wadden Sea. It consists of 150 Siemens 4 MW turbines installed across two locations (Buitengaats and Zee-Energie) 85 km north off the coast of the Wadden islands Ameland and Schiermonnikoog. The two export cables cross the Wadden Sea to reach the coast land at Eemshaven in the province of Groningen.
In September 2014 the Minister of Economic Affairs presented a guideline to parliament, outlining how the Government plans to achieve an upgrade of current 1,000 MW to 4,500 MW offshore wind capacity by 2023. The road map sets out a schedule of tenders offering 700 MW of development each year in the period 2015 – 2019. The Government has decided that three offshore wind farm zones off the West coast of the Netherlands will be used for the deployment of the targeted 3,500 MW new offshore wind capacity: Borssele (1,400 MW), South Holland coast wind farm zone (1,400 MW) and North Holland coast wind farm zone (700 MW).
To facilitate the tight schedule of this road map, a new system was designed for the deployment of these new wind farms. This approach contributes to the efficient use of space, cost reduction and an acceleration of the deployment of offshore wind energy. Under this new system, the Dutch government designates Offshore Wind Farm Zones (see Figure 6). Any locations outside these zones are not eligible to receive a permit. Any of these zones have been designated inside the Wadden Sea.
The first two tenders for the Borssele Wind Farm Zone have been successfully completed. Both 700 MW wind farms will be built for a record low price. Considering this success and the further need for sustainable energy in the Netherlands, it is expected that a subsequent round of offshore wind farms will be planned for development in the residual designated zones, mainly situated off the West coast of the Netherlands. However, one designated Wind Farm Zone is situated adjacent to the Gemini wind farm (Figure 6) and if it will be selected for further developments, the export cables would need to cross parts of the Wadden Sea.
Table 1. Operational and currently constructed North Sea offshore wind parks in the Netherlands.
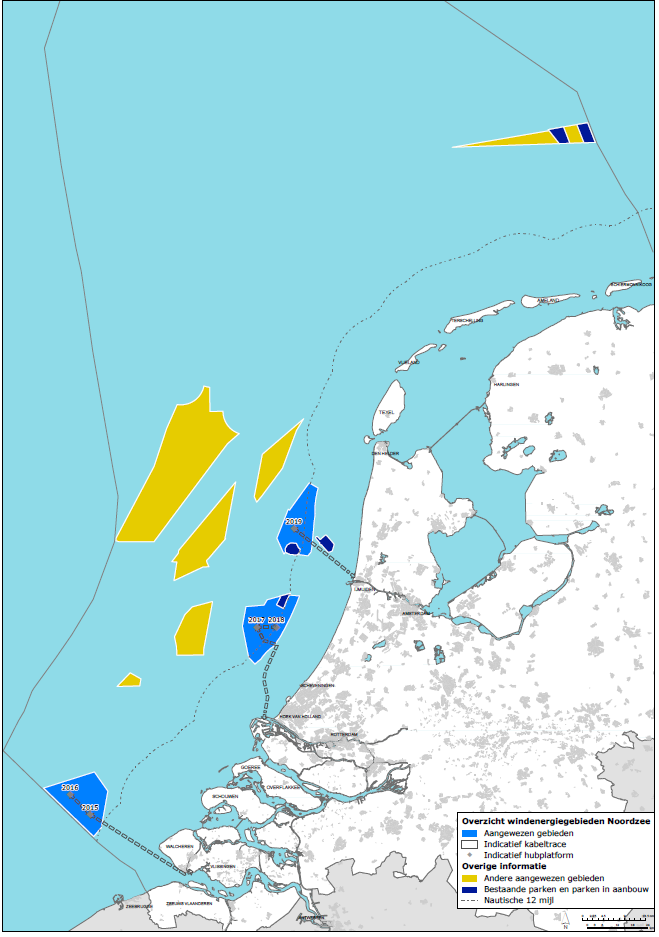
Figure 6. Tender timetable for the Dutch offshore wind developments. Wind Farm Zones to be tendered are marked light blue, established wind farms in dark blue and Wind Farm Zones designated for future development in yellow (Source: www.noordzeeloket.nl).
In 2019 it is foreseen that the Fryslan windfarm will be built in the Ijsselmeer directly south from the Afsluitdijk, adjacent to the Wadden Sea. This farm will consist of 89 turbines with a total capacity of 320 MW and an annual production of 1184 Gwh/yr. This would equal the supply for approx. 340,000 households.
Germany
The construction of wind turbines is not allowed in the Wadden Sea Conservation Area. In Germany, this includes the Halligen, the geest parts of the islands Amrum, Föhr and Sylt, as well as the areas seaward of the dikes in the Wadden Sea Area (QSR 2009). Currently, a total of six wind turbines are located on the islands in Lower Saxony: one turbine on Spiekeroog and five turbines on Borkum (Figure 7A) and there are 18 turbines on the Frisian Islands off the coast of Schleswig-Holstein: three turbines on Föhr (repowered from twelve turbines in 2015), six turbines on Pellworm (repowered from eight turbines) and nine turbines on Nordstrand (Figure 7B).
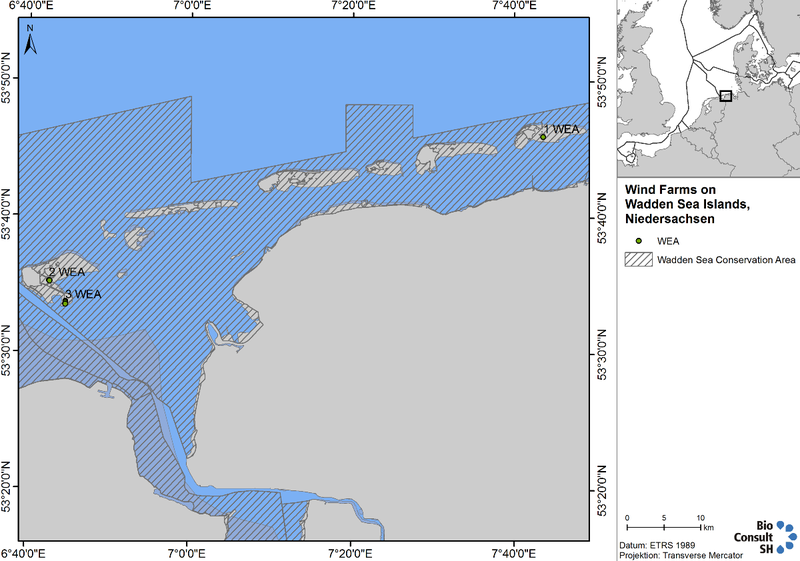
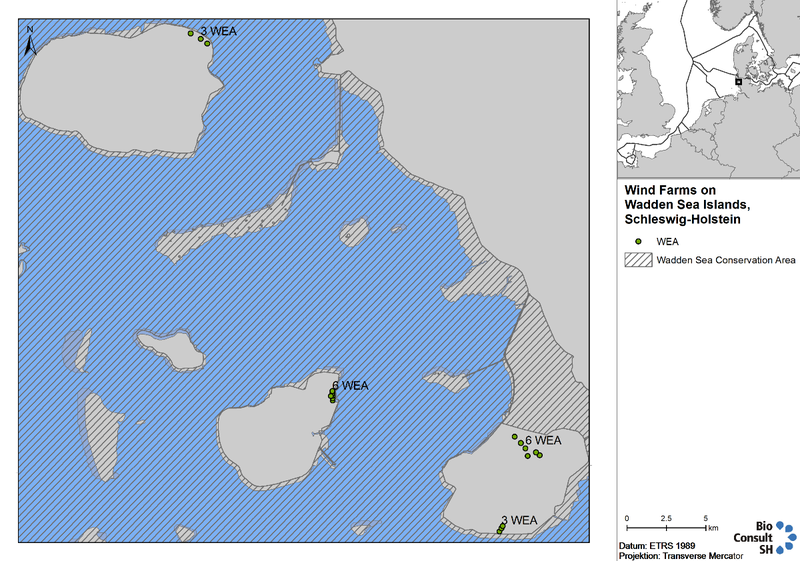 Figure 7. Left (A): Location and number of installed wind turbines on islands off the coast of Lower Saxony (Source: Amt für regionale Landesentwicklung Lüneburg Raumordnung und Landesplanung, 12.06.2015); Right (B): Location and number of installed wind turbines on North Frisian Islands (Source: LLUR 06.05.2015, updated).
The German government's energy concept aims at an offshore wind energy capacity of 15,000 Megawatt in the North Sea and the Baltic by 2030. To achieve these goals, Germany focussed on areas with higher water depth and distances from the coast, in order to avoid environmentally sensitive areas. Furthermore, even more distant offshore areas are not in focus of any developments over the next ten years, as the capacity targets can be met within the already approved offshore development zones. In order to meet these objectives and to gain planning security for the parties involved, the implementation of a Spatial Offshore Grid Plan was considered as necessary. This was decided in the context of the political 'Energiewende'-decisions in June 2011 and amended in December 2012.
The Offshore Grid Plan identifies those wind farms suitable for collective ‘cluster’ grid connections. The plan assembles the cable routes for interconnectors, and descriptions of possible joint connections, and aims fora system of efficient grid expansion and lower environmental impact. In addition, the Offshore Grid Plan contains standardised technical specifications and planning principles to create a reliable planning basis. The plan stipulates that the grid connections for offshore wind farms must generally be implemented as collective grid connections, so called clusters, which consist of a number of wind farms spatially connected to one another, in an effort to reduce the length of necessary cable connections. The majority of energy connections currently run between the islands of Lower Saxony to reach the mainland (Figure 8A). The plan contains staggered spatial planning until 2030. Within the framework of the planning period until 2022, locations of eight suitable windfarm clusters have been identified (Figure 8B).
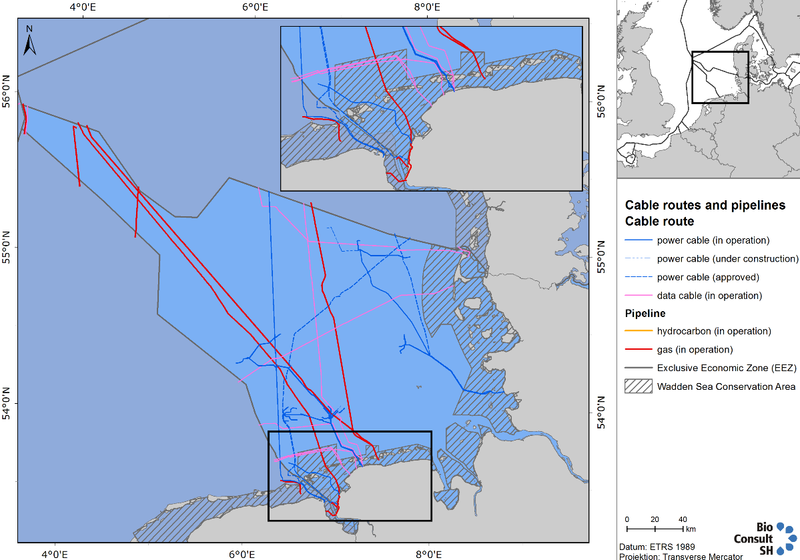
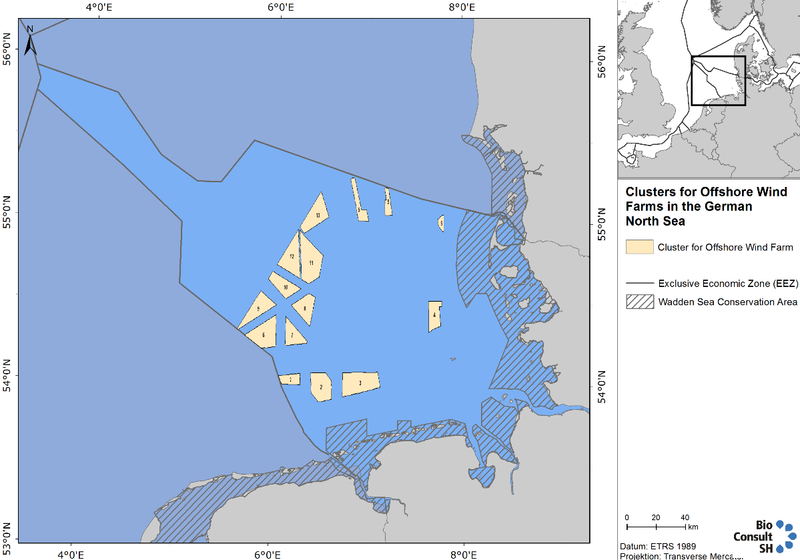 Figure 8. Left (A): Cable and pipeline routes for wind farm grid connections and gas/hydrocarbon connections; Right (B): Number and position of suitable wind farms clusters in the German Bight (Source: Bundesamt für Schifffahrt und Hydrographie).
Since the adoption of the Renewable Energy Sources Act (RES-Act), in force since 1 April 2000, and its revision in 2014, the proportion of power generation accounted for by renewable energy has risen from 6 % in 2000 to 32.6 % in 2015. The contribution made by renewable energy sources is constantly growing and the amount covered by offshore wind energy was 13.3 % in December 2015. The maximum legally assignable grid connection capacity until the end of 2017 is 7,700 MW for projects that can be installed before 2020.
Progress towards the targets set by the federal government in 2014 is fast: by the end of 2014 the wind energy capacity in Germany´s North Sea and Baltic Sea reached 2,340 megawatt. One year later, in December 2015, 3,295 megawatt was connected to the grid and fully commissioning, compiling 43 % of 7,700 megawatt. A final investment decision had been made for more 865 megawatt (11 %). In total 70 % of the assigned grid connection capacity (7,700 megawatt) is in solid progress or has been finalised. Commitment to further 2,338 megawatt (30 %) grid connection has been made, which needs further financing and implementation within the next couple of years.
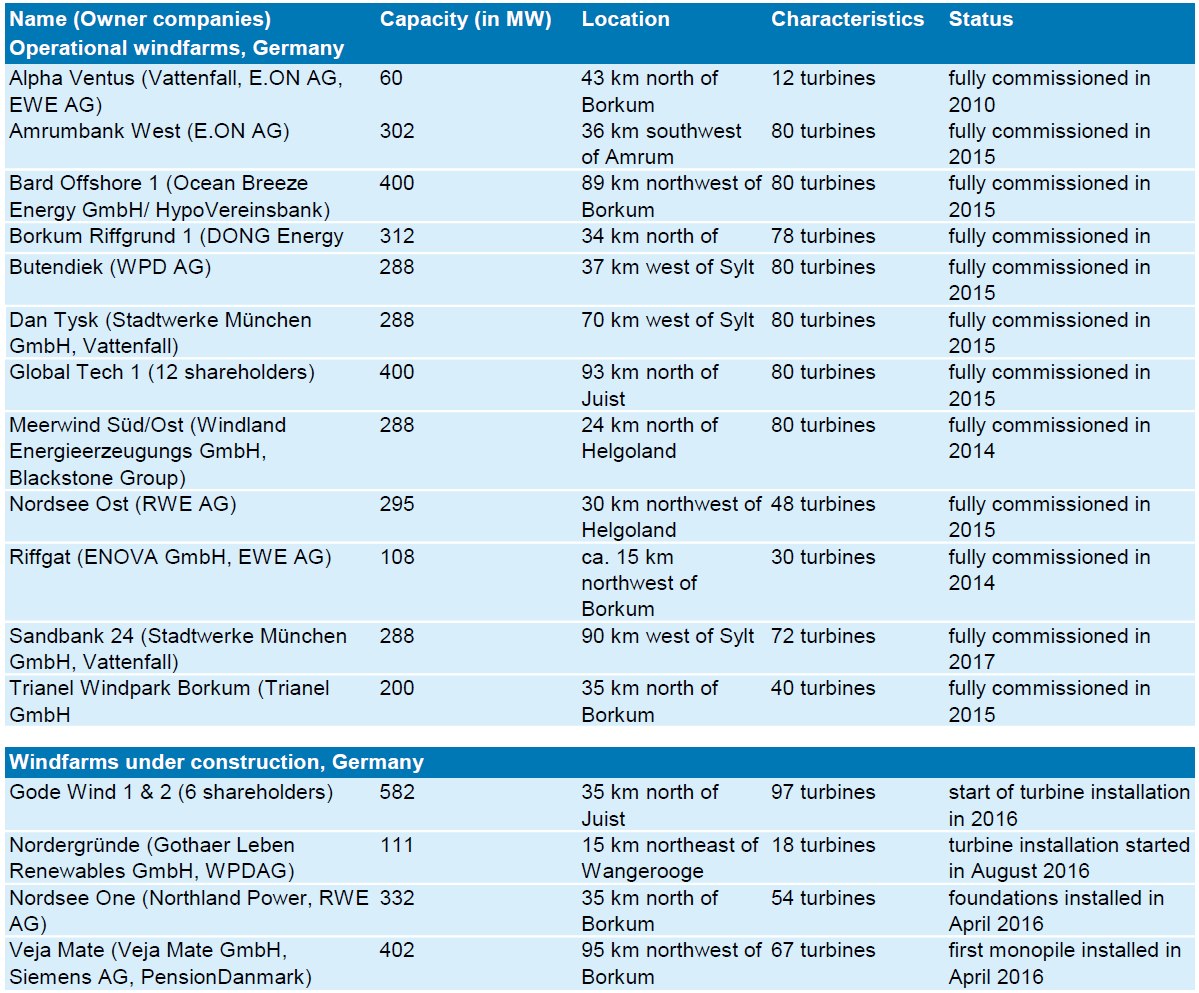
At this point 16 windfarm projects are fully commissioned or under construction in the North Sea (see Table 2, Figure 5) and a further 18 windfarm projects are already approved but nor planned yet. Four coastal wind farms (“Nordergründe”, “Hooksiel”, “ENOVA Ems Emden” and “Riffgat”) are planned within the twelve miles zone and three of these four, “Hooksiel” (five turbines), “ENOVA Ems Emden” (one turbine) and “Riffgat” (30 turbines) are already built and fully commissioned.
Table 2. Operational and currently constructed North Sea offshore windparks in Germany.
Denmark
In Denmark the responsibility for the deployment of offshore wind farms lies with the government. To provide a basis for long-term planning, the government has created the Committee for Future Offshore Wind Turbine Locations, which identifies the most suitable areas for offshore wind farms, taking into account the geographical conditions as well as various sectors’ interests in the area, such as shipping, mining and fishing. Based on the recommendations of this committee, politicians decide which parks to put out to tender.
Three licences are required to build a government sponsored offshore wind farm in Danish waters — a licence for preliminary site investigations, a licence to install turbines and a licence to exploit wind power for a given period. All three are granted by the Danish Energy Agency (DEA).
Currently there are two established offshore wind parks in the Danish North Sea: Horns Rev 1 and Horns Rev 2, which were fully commissioned in 2002 and 2010, respectively. Together they provide a capacity of 369.3 MW. In 2014 a third large-scale offshore wind farm was put out to tender, Horns Rev 3, with a total of 50 turbines providing 400 MW. In February 2015 Vattenfall was awarded the tender for Horns Rev 3 and realisation has begun.
Table 3. Operational and authorized North Sea offshore wind parks in Denmark.
3. Summary
Gas, oil and wind are energy sources exploited directly in or at least with effects to the Wadden Sea. In the Netherlands gas subtractions partially cause subsidence effects, with impact to an ecosystem under the influence of changing sea levels. The only active oil field in operation in the Wadden Sea is located in Schleswig-Holstein and is being exploited from an artificial island.
In addition to fossil fuels still being harnessed exclusively in the Dutch and German Wadden Sea, all three Wadden Sea states have increased their wind farming activities. The vast majority of offshore wind power plants are positioned in the North Sea. However, transfer cables to the coastline are laid through the Wadden Sea causing impact.
About the authorsJ. Baer, G. Nehls BioConsult SH GmbH & Co.KG, Schobüller Str. 36, 25813 Husum, DE |
References
BSH (2012) Spatial Offshore Grid Plan for the German Exclusive Economic Zone of the North Sea and Non-technical Summary of the Environmental Report. Bundesamt für Seeschifffahrt und Hydrographie (BSH) Hamburg und Rostock 2013.
De Waal J.A., Roest J.P.A., Fokker P.A., Kroon I.C., Breunese J.N., Muntendam-Bos A.G., Oost A.P. & van Wirdum G. (2012) The efective subsidence capacity concept: How to assure that subsidence in the Wadden Sea remains within defined limits? Netherlands Journal of Geosciences 91 (3): 385-399.
European Wind Energy Association (2016) The European offshore wind energy - key trends and statistics 2015.
Nehls, G. & Witte, S. (2009) Energy. Thematic Report No. 3.6. In: Marencic, H. Vlas, J. de (Eds), 2009. Quality Status Report 2009. Wadden Sea Ecosystem No. 25. Common Wadden Sea Secretariat, Trilateral Monitoring and Assessment Group, Wilhelmshaven, Germany.
Schoemann P.K. (2006) Wadden Islands (the Netherlands). Eurovision Case study, Ministry of Transport, Public works and water management, 18 pp.
Van Thienen-Visser K. & Breunese J.N.(2015) Subsidence due to gas production in the Wadden Sea: How to ensure no harm will be done to nature. ARMA, American Rock Mechanics Association Symposium, San Francisco, 1 July 2015.
This report should be cited as: Baer, J., & Nehls, G. (2017). Wadden Sea Quality Status Report: Energy. Common Wadden Sea Secretariat. https://doi.org/10.5281/zenodo.15225991
All 2017 reports may be cited collectively as: Kloepper, S., Baptist, M. J., Bostelmann, A., Busch, J.A., Buschbaum, C., Gutow, L., Janssen, G., Jensen, K., Jørgensen, H.P., de Jong, F., Lüerßen, G., Schwarzer, K., Strempel, R., & Thieltges, D. (2017). Wadden Sea Quality Status Report. Common Wadden Sea Secretariat, Wilhelmshaven, Germany. Downloaded DD.MM.YYYY. qsr.waddensea-worldheritage.org


