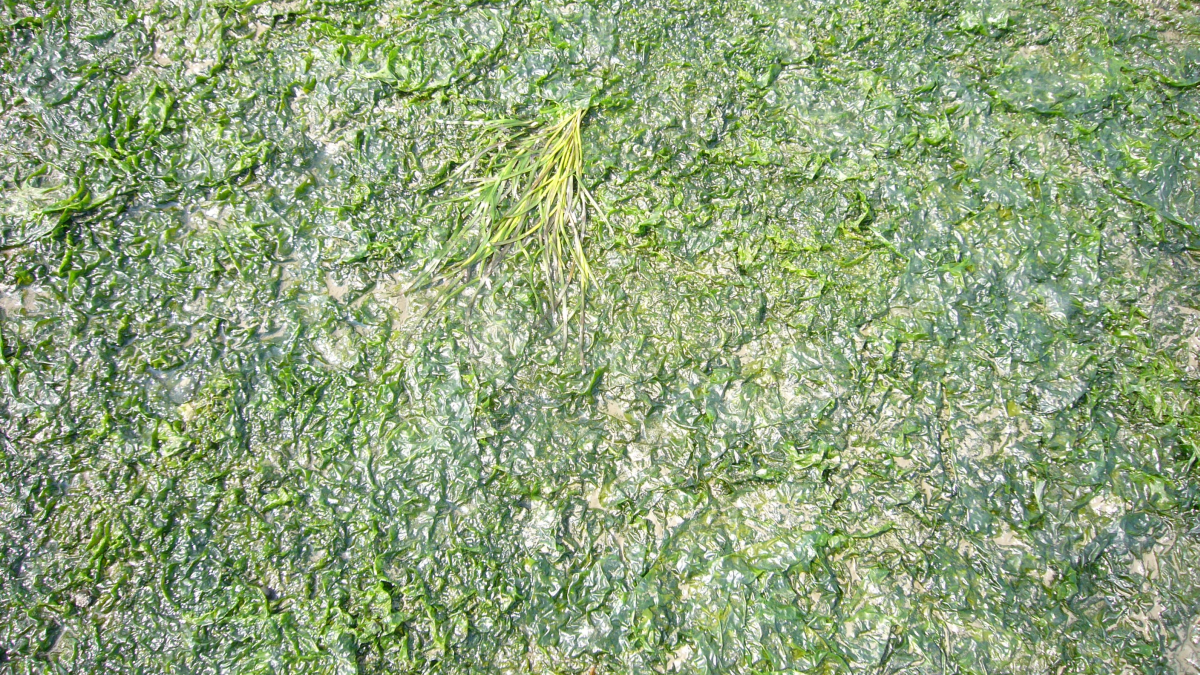
Photo: Jürgen Steuwer. Macroalgae on top of seagrass.
Eutrophication
J.E.E. van Beusekom, P. Bot, J. Carstensen, A. Grage, K. Kolbe, H.-J. Lenhart, J. Pätsch, T. Petenati & J. Rick
Published 2017
(Version 1.01)
1. Introduction
Eutrophication is one of the factors that influence the environmental quality of the Wadden Sea area. Since the earliest nutrient measurements in the Wadden Sea during the mid-20th century (Postma, 1954; Postma, 1966; Hickel, 1989) a clear increase in nutrient concentrations until the 1990s has been documented (e.g., de Jonge & Postma, 1974, Hickel, 1989, van Beusekom et al., 2001). Among the negative effects associated with the increased nutrient inputs are more intense Phaeocystis-blooms (Lancelot et al., 1987), a decline in seagrass distribution (de Jonge & de Jong, 1992), increased cover with green macroalgae (Reise & Siebert, 1994) and anoxic sediments (Black Spots, de Jong et al., 1999a). Measures were taken during the 1970s and 1980s to address eutrophication (de Jong, 2007) through a reduction of riverine nutrient inputs to the North Sea, which have been effective since the mid-1980s (Radach & Pätsch, 1997).
A trilateral target was adopted to aim for ”A Wadden Sea that can be regarded as a eutrophication non-problem area“. The concept of the eutrophication problem and non-problem-areas was introduced in the framework of OSPAR (1997). In the Wadden Sea Plan 2010 (CWSS, 2010) it was noted that “Though input of nutrients, especially of phosphate, has decreased, the entire Wadden Sea still has to be considered a eutrophication problem area, meaning that the target of a Wadden Sea which can be regarded as “eutrophication non-problem area” has not yet been met. Regional differences observed indicate a more intense eutrophication in the southern as compared to the northern Wadden Sea.”
Two EU legislations are in place also aiming at “Good Ecological Status” (Water Framework Directive; WFD) or “Good Environmental Status” (Marine Strategy Framework Directive; MSFD). However, no Wadden Sea wide agreement has been reached yet on all aspects including a harmonized assessment based on phytoplankton biomass.
In the following sections, recent trends in riverine nutrient loads and in the response of phytoplankton biomass to decreasing nutrient inputs are presented. Focus of the trend analysis is on long time series (starting before 1990) in order to (1) cover at least part of the high nutrient load years of the 1980s and to (2) place the more recent data into a longer time perspective. The present report differs from the previous QSR (2009) in that more attention is given to individual stations. Reasons are (1) the necessity to better understand regional differences and (2) the decreasing number of long-term stations.
2. Status & Trends
2.1 Riverine input
The major driver of Wadden Sea eutrophication is riverine nutrient input. Indeed, many of the rivers draining continental northwestern Europe enter the North Sea and influence the Wadden Sea either directly through discharge to the Wadden Sea or indirectly with the residual currents transporting river water from the French, Belgian and Dutch coast to the Wadden Sea. Nutrient loads of major rivers influencing the southern Wadden Sea (Rhine, Meuse, Noordzeekanaal, IJsselmeer, Ems) and the major rivers influencing the northern Wadden Sea (Weser, Elbe) were lumped together; data were compiled by Pätsch & Lenhart (2004) and updated until 2014.
In the previous QSR’s the decreasing trend in annual nutrient loads was already documented. These decreasing trends have continued. The annual loads depend on both the amount of freshwater discharge and the riverine nutrient concentrations. First, freshwater discharge is presented, then total nutrient loads and finally trends of discharge-weighted nutrient concentrations.
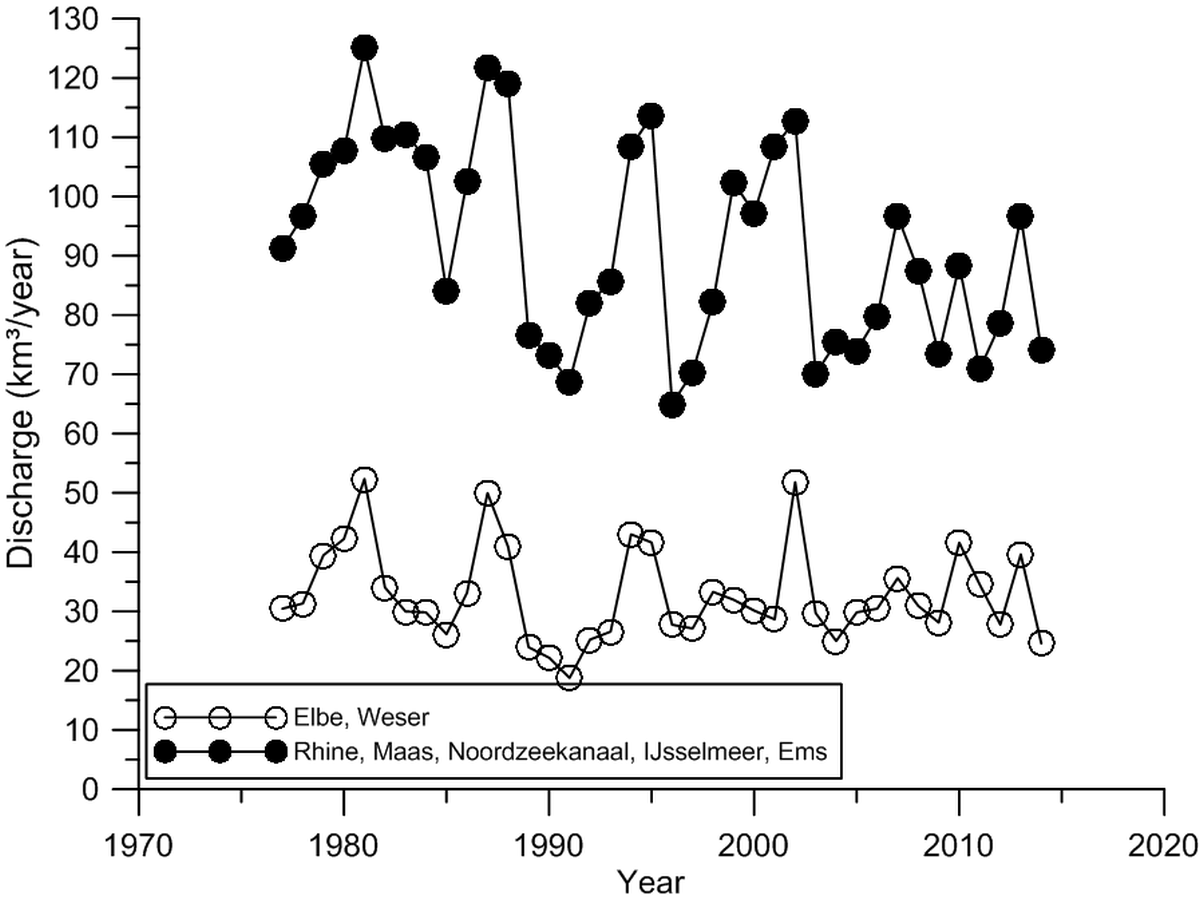
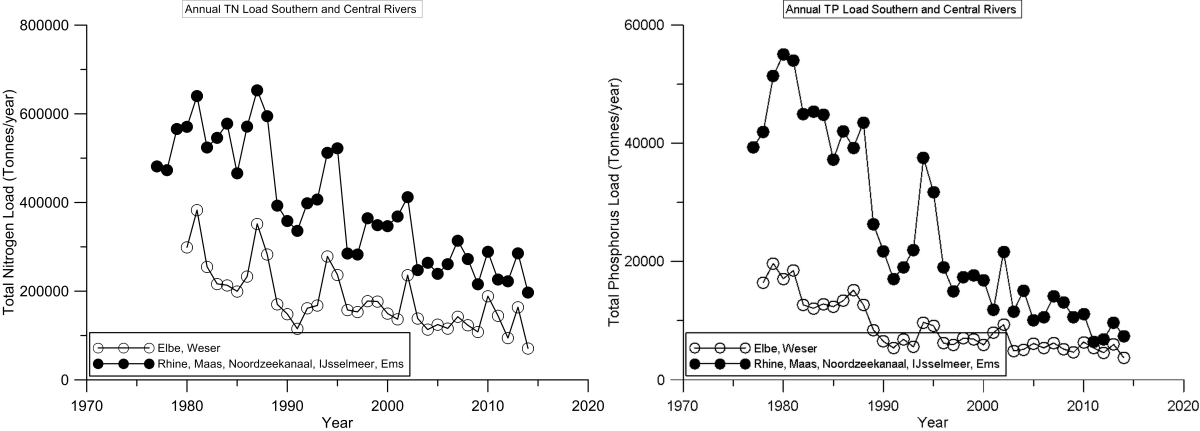
Recent freshwater discharges were lower than the high values in the 1980s and around 2000, but not as low as around 1990 (Figure 1). Recent total nitrogen (TN) and total phosphorus (TP) inputs were also low compared to earlier years and reached the lowest values since the start of the time series. Compared to the 1980s, the TN inputs have been reduced by ~50 %, TP inputs by 50 – 75 % (Figure 2).
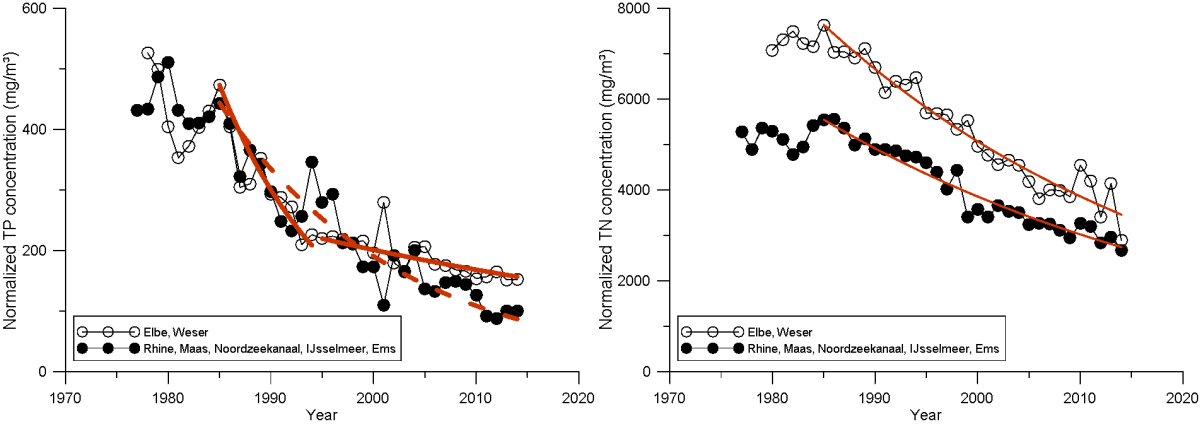
Flow-weighted (normalized) nutrient concentrations were calculated by dividing the total annual nutrient input by the annual freshwater discharge. The flow-weighted TP concentrations have decreased continuously since the 1970s, whereas the flow-weighted TN concentrations have decreased since the mid-1980s (Figure 3). A simple model was applied, describing the decrease since 1985 by taking the 1985 value, assuming a constant relative decrease, and estimating the decreasing rate with the least square method. Overall, the decrease of the flow-weighted TN concentrations was 2.4 % per year for the rivers impacting the southern Wadden Sea and 2.7 % per year for rivers impacting the northern Wadden Sea. For flow-weighted TP, the decrease was even stronger with 5.5 % per year for the rivers impacting the southern Wadden Sea and 5.3 % per year for rivers impacting the northern Wadden Sea. The rates of decline compared strikingly well.
A continuous decrease in flow-weighed TP concentrations was not the best assumption for the Elbe and Weser rivers. A segmented trend with a strong decrease of 8.7 % per year between 1985 and 1994 and a much slower decrease of 1.8 % per year since 1995 gave a better description. A closer look at the TP inputs from the Elbe and Weser rivers show that during the past two decades changes over time were marginal and it is likely that TP inputs will not decrease any further during the coming years.
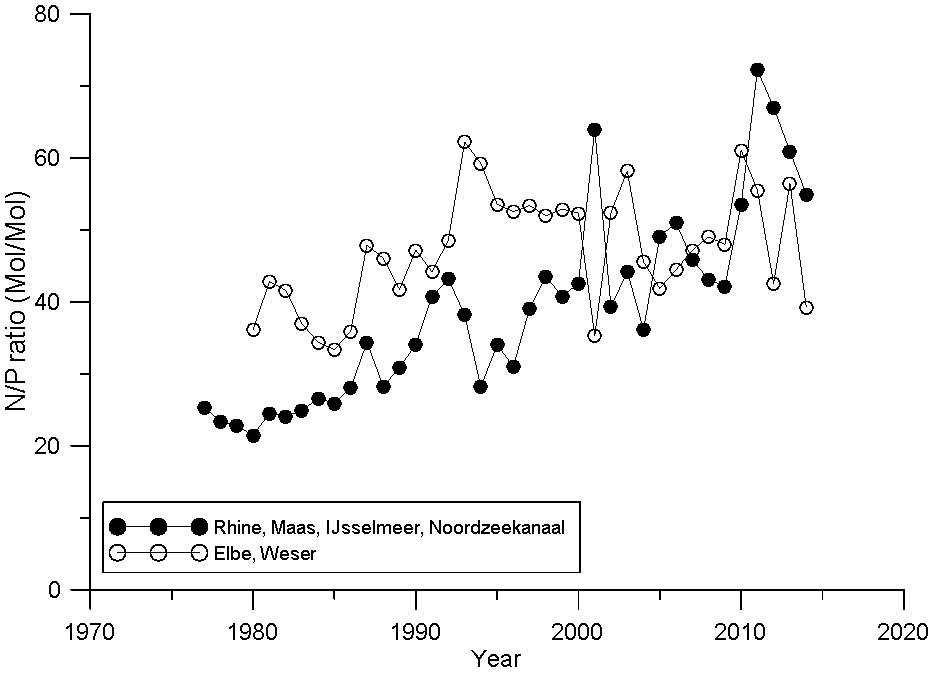
As TP decreased faster than TN, the N/P molar ratio increased from 20 to 40-70 in the rivers impacting the southern Wadden Sea (Figure 4). The decrease in the rivers impacting the northern Wadden Sea increased from 40 to 50-60 and remained between 40 and 60 since, reflecting the low decrease rate in TP since the mid 1990s. The N/P ratio in the rivers impacting the southern Wadden Sea continuously increased with a rate of about 1 unit per year.
Figure 1. Major annual freshwater discharges influencing the Southern Wadden Sea (Rhine, Meuse, Noordzeekanaal, IJsselmeer and Ems) and the Central and Northern Wadden Sea (Weser, Elbe) (Source: Pätsch & Lenhart, 2004; updated to 2014).
Figure 2. Major riverine TN and TP loads to the Southern Wadden Sea (Rhine, Meuse, Noordzeekanaal, IJsselmeer and Ems) and to the Central and Northern Wadden Sea (Weser, Elbe) (Source: Pätsch & Lenhart, 2004; updated to 2014).
Figure 3. Normalized nitrogen and phosphorus concentration (mean annual load / mean annual discharge) to the Southern Wadden Sea (Rhine, Meuse, Noordzeekanaal, IJsselmeer and Ems) and to the Central and Northern Wadden Sea (Weser, Elbe) (Source: Pätsch & Lenhart, 2004; updated to 2014). The red lines are the modeled decrease since 1985. For phosphorus in Elbe/Weser, two phases (solid line, 1985-1994, fast decrease and 1995–2014; slow decrease) were assumed.
Figure 4. TN/TP ratio (mol/mol) of the major riverine loads to the Southern Wadden Sea (Rhine, Meuse, Noordzeekanaal, IJsselmeer and Ems) and to the Central and Northern Wadden Sea (Weser, Elbe) (Source: Pätsch & Lenhart, 2004; updated to 2014).
2.2 Long term trends in phytoplankton biomass
Enhanced nutrient availability can stimulate phytoplankton growth. It is time-consuming to estimate phytoplankton biomass and as a proxy the chlorophyll a (Chla) content is used. The previous QSR has shown that Chla is a useful indicator of eutrophication status, provided that long time series are available. During the past decades, the effort to monitor the Wadden Sea eutrophication has changed. In particular, the number of stations in the Danish and in the Dutch Wadden Sea has decreased. The previous QSR trends were based on regional averages but the decreasing number of stations potentially biases trends. Therefore, more attention was given to individual trends observed in the few remaining continuous time series. Moreover, a better overview on spatial differences can be obtained by comparing trends from different stations rather than entire regions.
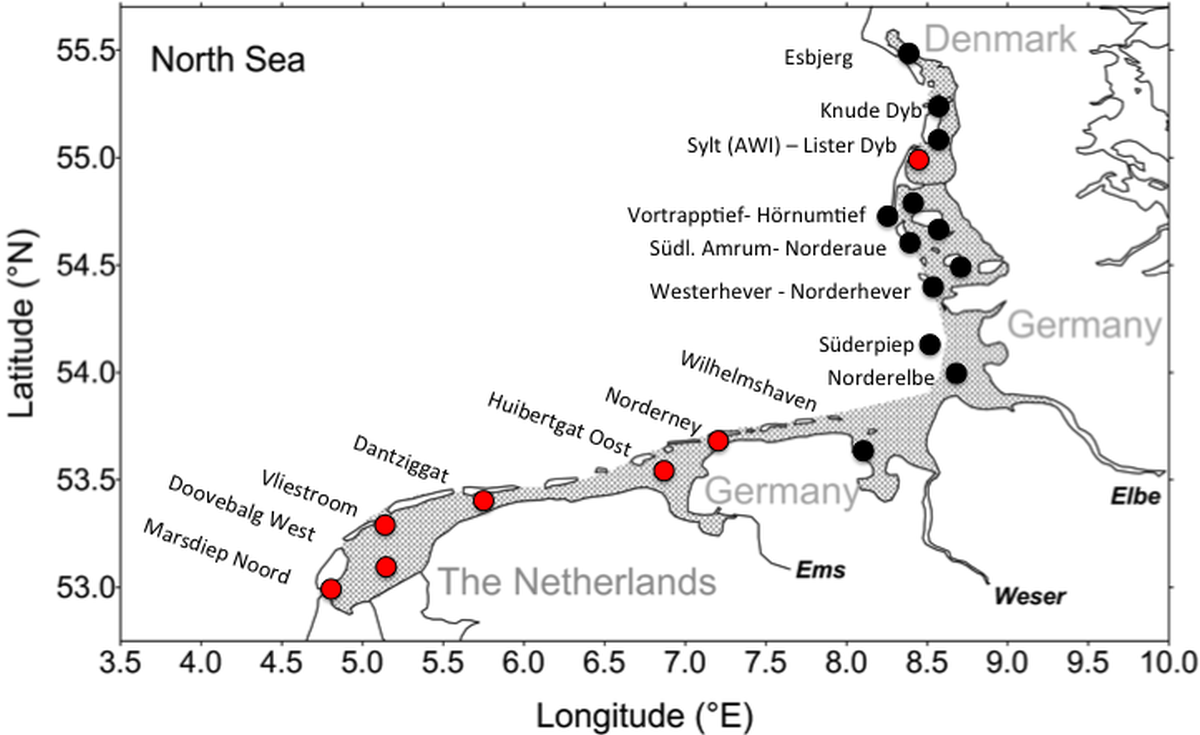
Only few stations have continuous data starting in the 1980s or earlier, covering the entire annual cycle and lasting until 2014. For the Dutch Wadden Sea, these are “Marsdiep Noord”, “Vliestroom”, “Doovebalg West”, “Dantziggat” and “Huibertgat Oost” with data from 1977 onward. Observations at Norderney (Lower Saxon Wadden Sea) started in 1987. For the northern Wadden Sea (Schleswig Holstein), long-term data from the Wadden Sea Station Sylt (AWI) are available since 1984. The positions of the stations are indicated by red dots in Figure 5.
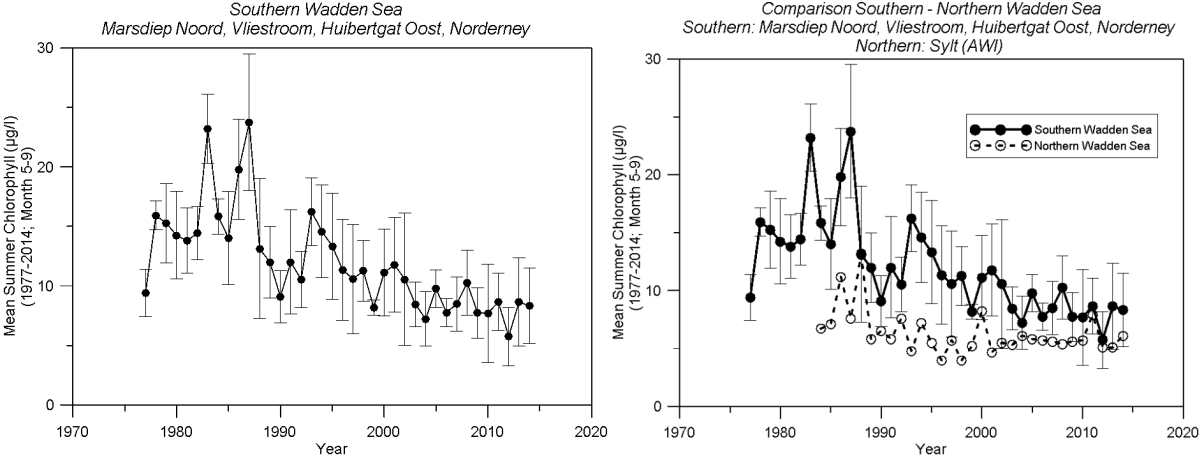
Long-term trends are best exemplified with the tidal inlet stations from the southern Wadden Sea (“Marsdiep Noord”, “Vliestroom”, “Huibertgat Oost”, “Norderney”). The Dutch stations cover the period before and after the maximum nutrient loads during the 1980s. Following the previous QSR, summer Chla as a proxy for Wadden Sea eutrophication was used. First, monthly means were calculated. Next, the means from May – September were used to calculate an annual mean for each station. The average summer chlorophyll for the Southern Wadden Sea reached on average a maximum of almost 25 µg Chla/l during the 1980s and 1990s, gradually decreasing to levels of about 10 µg Chla/l during the past decade (Figure 6). Recent levels are below the minimum values of 1978-1988.
The long-term trend for the Sylt time series (AWI) started in 1984 and as for the southern Wadden Sea, highest values were found during the 1980s reaching up to 13 µg Chla/l before decreasing to present day levels around 5 µg Chla/l. These chlorophyll levels are about 50 % below the level observed in the southern Wadden Sea.
Figure 5. Map of the Wadden Sea with the stations used in the QSR. Red dots are time series stations. Black dots are stations used in addition to show the general distribution pattern for 2008–2014.
Figure 6. Long-term trends of summer chlorophyll from 1977–2014 for the long-term stations (>1985) of southern Wadden Sea stations (average of Marsdiep Noord, Vliestroom, Doovebalg West, Dantziggat, Huibertgat Oost, Norderney, left and right panel) and the northern Wadden Sea (Wadden Sea Station Sylt, AWI, right panel). Norderney data are available since 1987.
2.3 Correlations between riverine total N loads and summer chlorophyll
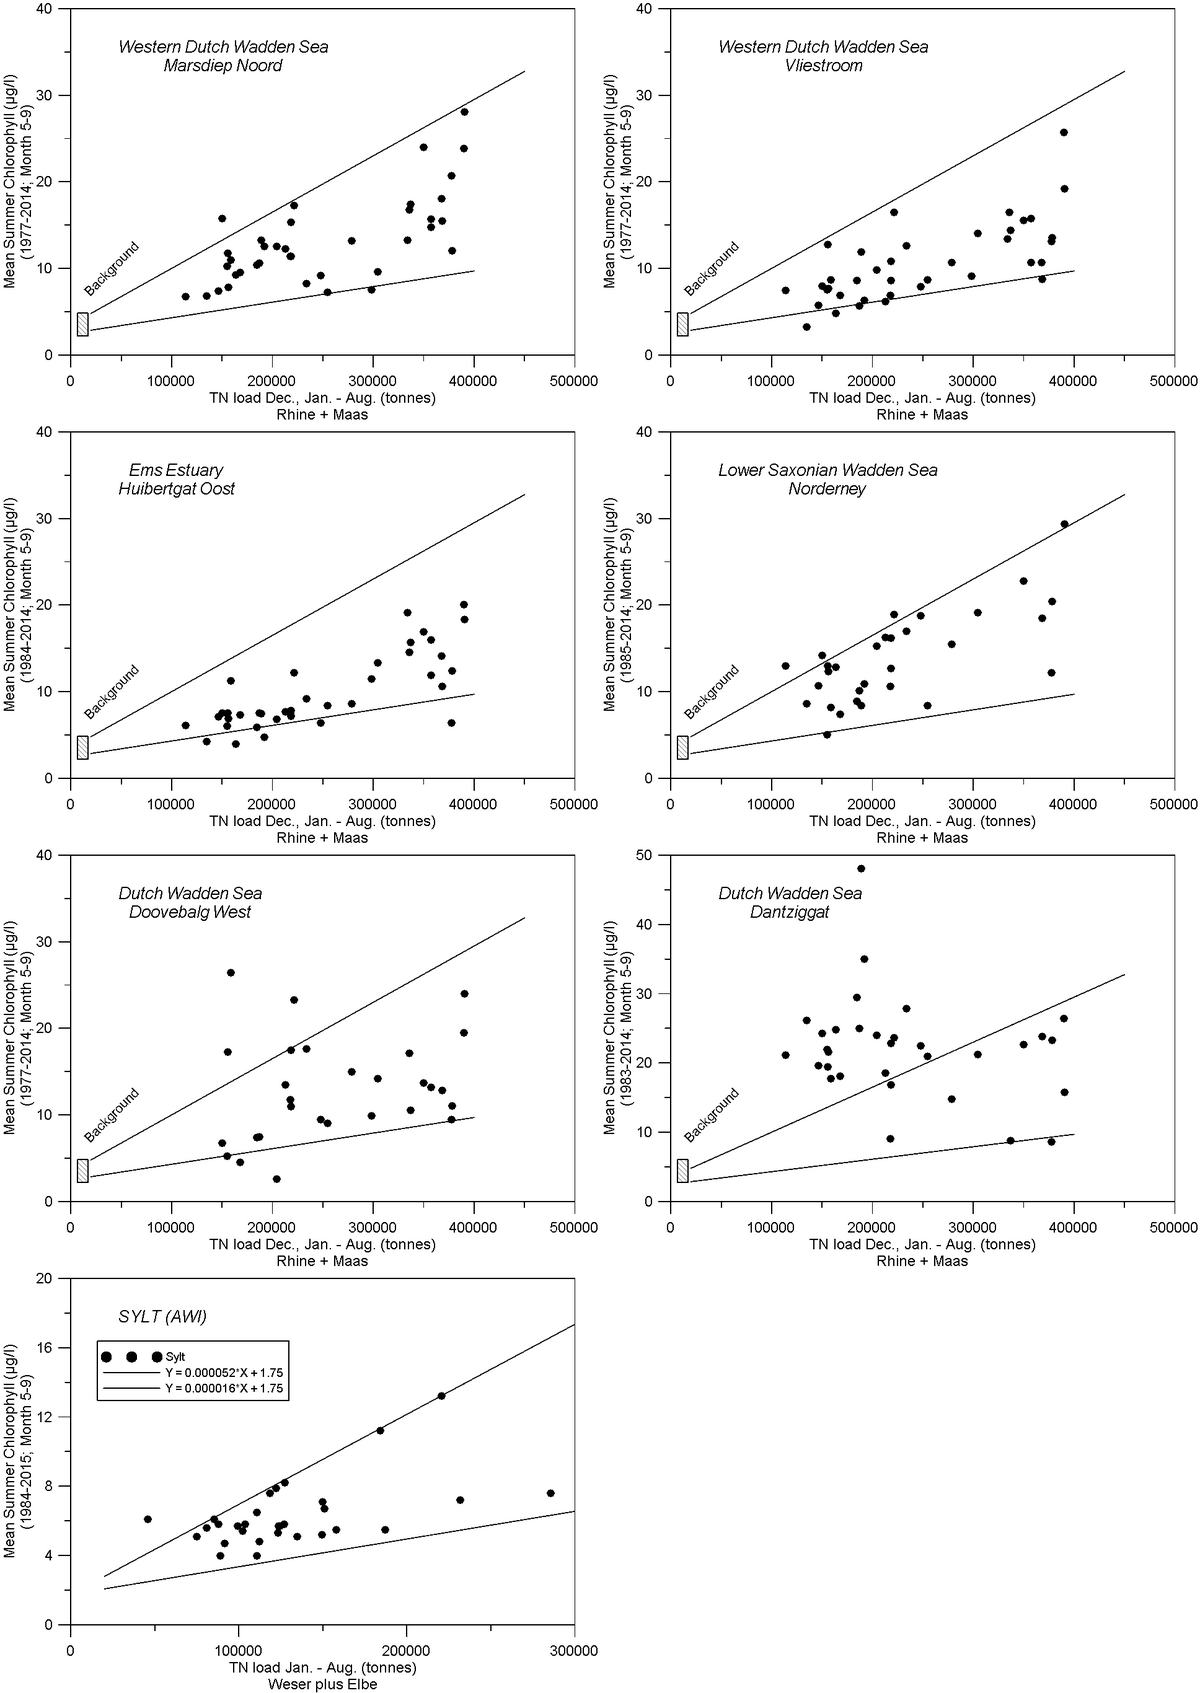
In total, the seven stations with long time series starting during the mid 1980s and two long-term stations from the Danish Wadden Sea (starting 1989/1990) were analyzed (Figure 7). For comparing stations, the relation between summer Chla and riverine TN inputs for “Marsdiep Noord” was projected to the other station plots. The scatterplots show highest summer Chla levels at highest riverine TN inputs. However, interannual variability is high. Within the range of riverine inputs, summer Chla levels vary by factor of three for a given riverine load (Figure 6). The two lines represent the range of values at “Marsdiep Noord” observed at a certain input level. Background estimates for the southern Wadden Sea (e.g., van Beusekom, 2005) are also indicated. These two lines and the background value are also indicated in the other graphs as a reference. Other Wadden Sea stations situated in tidal inlets (Vliestroom, Huibertgat Oost and Norderney) show a similar relation as the Marsdiep station, but the inner stations (Doovebalg West and Dantziggat) deviate markedly.
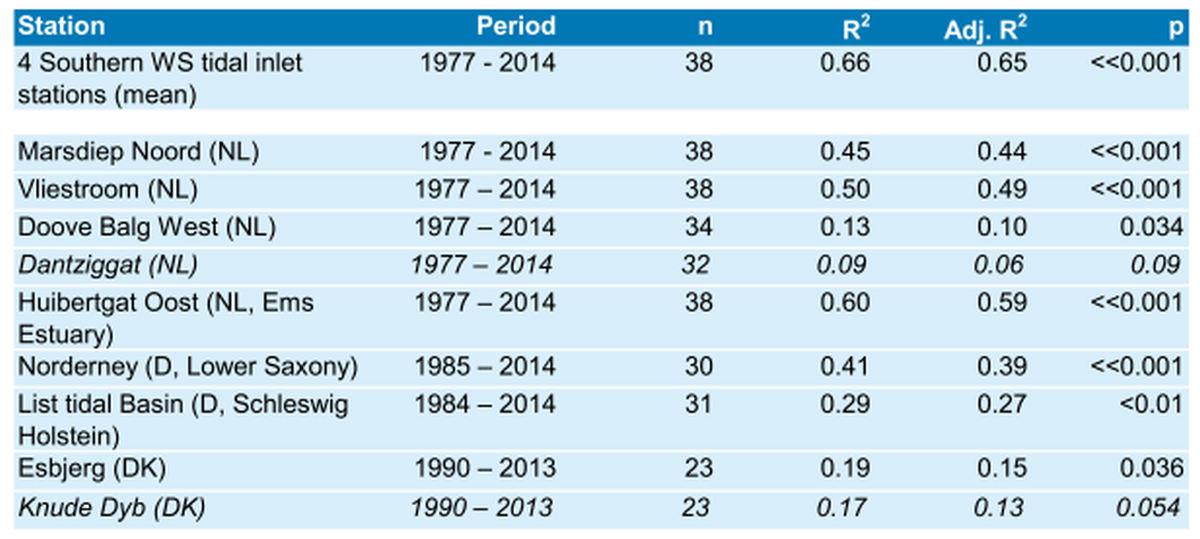
The Chla variability being proportional to the riverine nutrient load precludes the application of simple linear regression models and necessitates a log transformation of the Chla data. Correlations at all four tidal inlet stations are highly significant with an explained variability of between 49 % and 27 % (Table 1). The log of annual average of the four southern Wadden Sea stations (compare Figure 6) is also highly significantly correlated with riverine nutrient loads with an explained variability of R2=65 % (Table 1).
The relation between riverine TN input and summer chlorophyll in the interior of the western Dutch Wadden Sea (Doovebalg West) and towards the eastern Dutch Wadden Sea (Dantziggat) differ from the above tidal inlet stations. The correlation was only significant at Doovebalg West, whereas at Dantziggat a slight but insignificant increase in summer Chla was found. The latter possibly indicates improved light conditions for better local growth conditions as decreasing Chla levels elsewhere make an increased advection less probable.
Time series from the Danish Wadden Sea show borderline significance (p~0.05) and low explained variability R2 = 0.17–0.19. Apparently, the shorter time series (1990-2013) starting well after the eutrophication maximum during the early 1980s (compare Figure 6) are too short and do not fully capture large variation in nutrient inputs.
The impact of riverine nutrient input on phytoplankton biomass in the inner Dutch Wadden sea is possibly masked by other factors including light limitation (e.g., Colijn, 1982), advection from neighboring tidal basins (Duran-Matute et al., 2014) or from the coastal zone (Hofmeister et al., 2016), filter feeders (Cadée & Hegeman, 1974; Beukema & Cadée, 1996) or resuspended benthic microalgae (de Jonge & van Beusekom, 1995).
Table 1. Results from the statistical analysis of the correlation between riverine TN loads and summer chlorophyll a for all long-term stations. All chlorophyll data were log transformed. Italics: no significant correlation.
Figure 7. Correlation between summer chlorophyll and TN input from 1977 – 2014 for the long-term stations in the southern Wadden Sea (Marsdiep Noord, Vliestroom, Doove Balg West, Dantziggat, Huibertgat Oost, Norderney) and the northern Wadden Sea (Station Sylt, AWI). In the graphs of the southern Wadden Sea stations, approximate background values (e.g., van Beusekom, 2005) are indicated. The two lines frame the data points of the Marsdiep Noord station and serve as a reference for the other southern Wadden Sea stations. Note that the maximum Sylt chlorophyll values are about two times lower than in the southern Wadden Sea.
2.4 Recent spatial patterns in winter dissolved inorganic nutrients and summer phytoplankton biomass
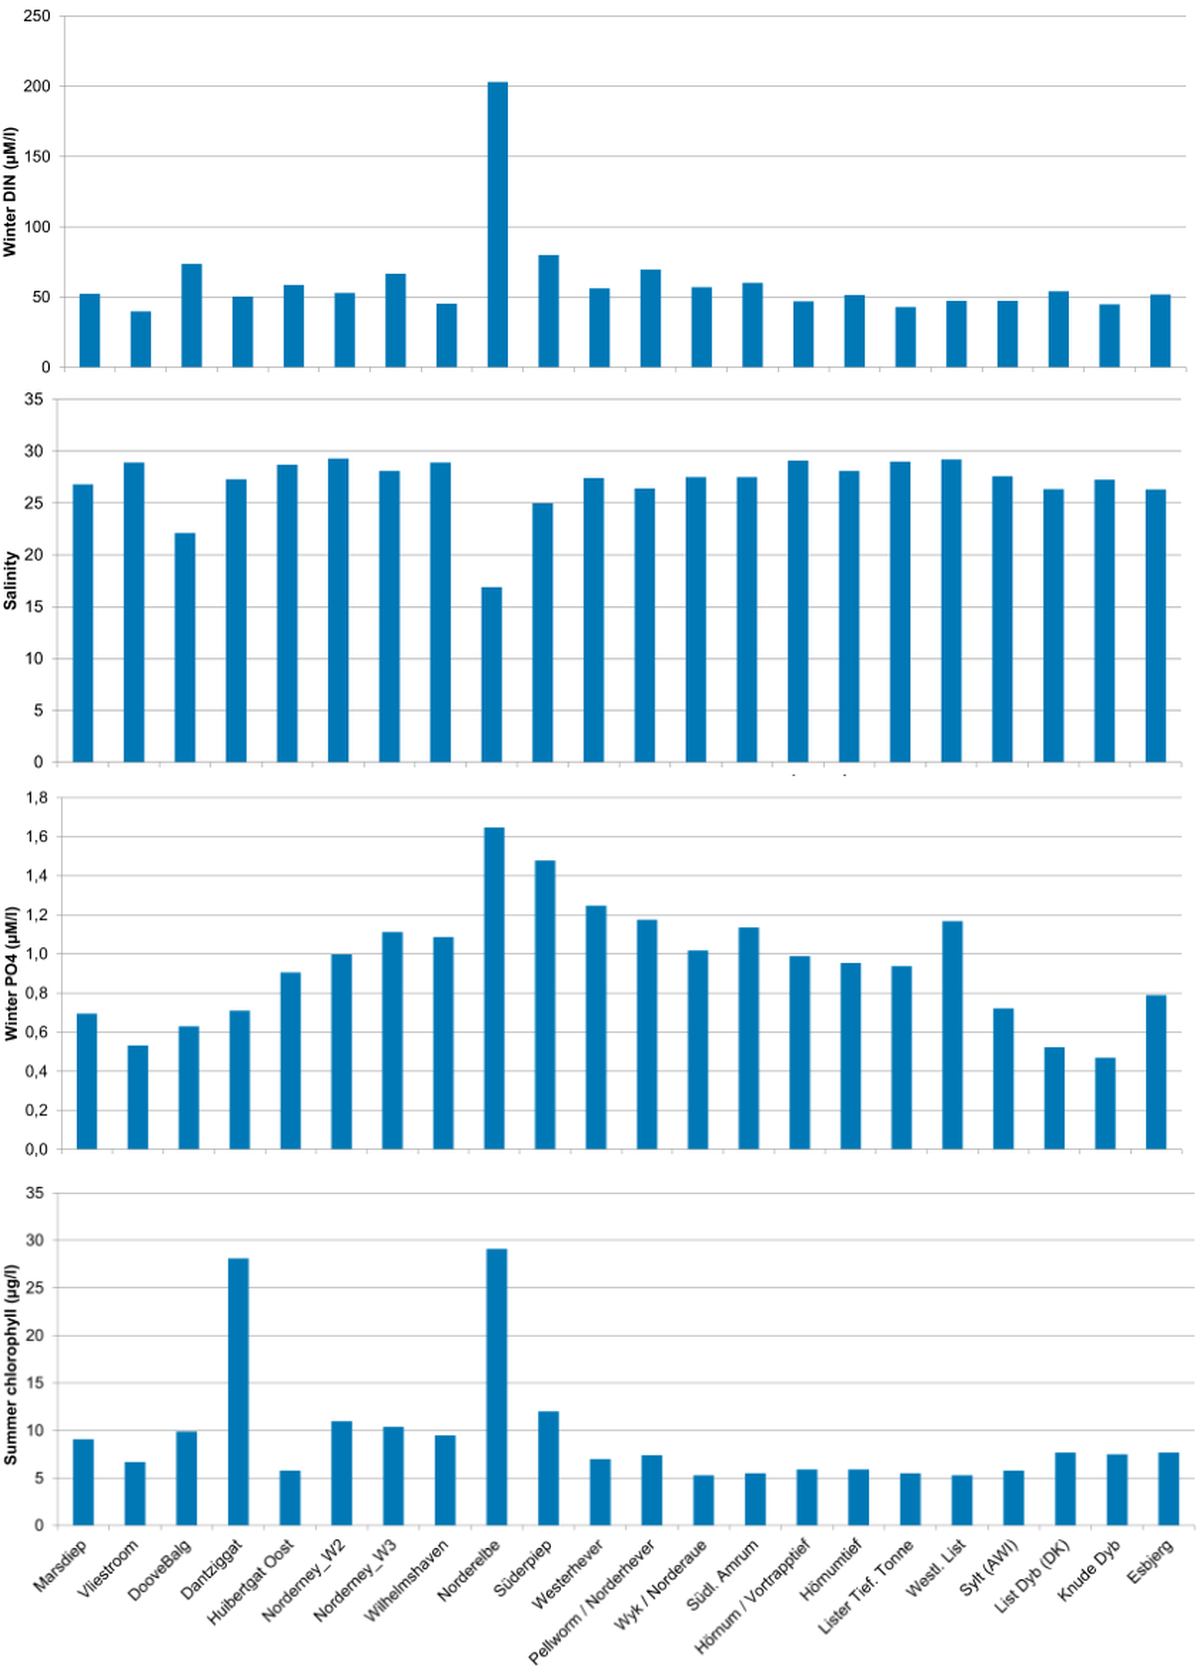
Whereas only a few stations have monitoring data to document long-term changes in the Wadden Sea, more stations are available to describe present (2008–2014) spatial differences (Figure 8). Winter nutrient concentrations determine to a large extent the production potential of the phytoplankton, especially in the coastal waters adjacent to the Wadden Sea where enough light is available. The limiting nutrient setting an upper limit for the production potential is still debated. Dissolved silica reaches low concentrations in spring and potentially limits diatom growth (Loebl et al., 2007, 2009). Potential phosphorus limitation, assessed from measured concentrations, is possible during early summer (Loebl et al., 2009; Ly et al., 2014) but phosphorus release from sediments may alleviate actual phosphorus limitation (Leote et al., 2016). Potential nitrogen limitation is only seen in the northern Wadden Sea and in most other coastal stations a co-limitation occurs towards the end of the growth season (Loebl et al., 2009).
Winter DIN (Dissolved Inorganic Nitrogen) concentrations (Jan.– Mar., 2008–2014) are shown together with the mean salinity for all stations covering (most of) the annual cycle (Figure 8). Most stations have salinity around 28 and DIN around 54 µM, although with increasing DIN and lower salinity towards the IJsselmeer (Doovebalg) and Elbe. Especially near the Elbe, high DIN values of up to 200 µM and salinities of about 17 are found. Winter DIP (Dissolved Inorganic Phosphorus) concentrations range between 0.5 and 1.6 µM. Interestingly, concentrations increase towards the central Wadden Sea and then decrease again towards the north. Salinity does not influence the concentrations as much as is the case for DIN. This is most probably due to adsorption-desorption processes (e.g., Froelich, 1988).
Winter DIN/DIP molar ratios are on average 67 (range: 41–123) and close to the riverine TN/TP ratio (average: 53, range: 39-72). The winter DIN/DIP ratio is much higher than the Redfield Ratio of 16 indicating a clear N surplus and a potential P limitation as observed in the Dutch Wadden Sea (Ly et al., 2014).
Summer Chla levels are mostly between about 5 and 11 µg Chla/l. Lowest values of between 5 and 6 are found in the central northern Wadden Sea. Notable exceptions are the high values in the Elbe estuary (29 µg Chla/l) and Dantziggat (28 µg Chla/l). Whereas the high Elbe values are in line with high winter DIN concentrations, the high chlorophyll values at Dantziggat are surprising. Possible explanations are 1) accumulation of phytoplankton biomass imported from adjacent tidal basins through cross-tidal divide transports (compare Duran-Matute et al., 2014) or 2) resuspension of microphytobenthos (de Jonge & van Beusekom, 1995).
This general pattern is in accordance with the results of the long time series shown earlier with lowest values in the northern Wadden Sea and highest values in the southern Wadden Sea. However, it should be noted that with decreasing chlorophyll values, the regional differences also become smaller and interannual, ecosystem-driven variability becomes more important. The summer Chla pattern does not clearly follow either the winter DIN or the winter DIP distribution. Especially, the high Chla values observed in the Dutch Wadden Sea are striking and it will be important to clarify the responsible processes.
Figure 8. Distribution of winter DIN, winter salinity, winter PO4 and summer chlorophyll along the Wadden Sea. Data are means of 2008–2014. Winter: mean of January–March, summer: mean of May-September.
2.5 Green macroalgal blooms
Macroalgal blooms were restricted to spring and early summer and to the upper intertidal during the early 20th century (e.g., Reise et al., 2008) but formed thick mats covering vast areas of tidal sediments in the northern and southern Wadden Sea (Reise & Siebert 1994; Kolbe et al., 1995, 2016). This phenomenon was also observed for other coastal areas around the world (Fletcher, 1996).
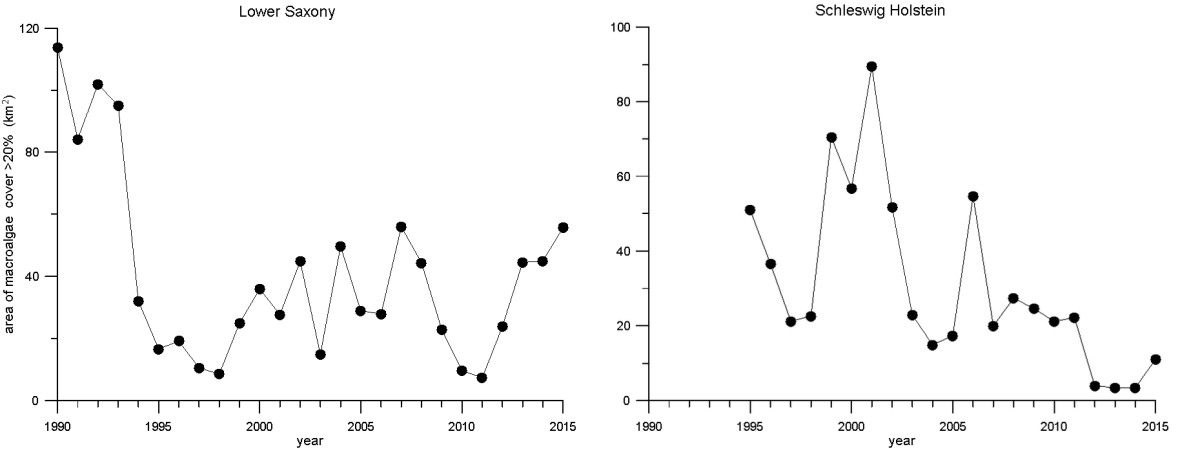
NLWKN (2016) has reported the macroalgae distribution in the Lower Saxon (LS) Wadden Sea since 1990 based on aerial observations (Figure 9A). Large macroalgae coverages were observed in 1990–1993, 1999–2008 and more recently in 2012–2014, whereas lower spread was found during 1995–1998 and 2010–2011. Overall, a high variability and a slight decrease is observed with recent maximum macroalgae spatial extent being almost half the level during the early 1990s.
Dolch et al. (2015) estimated the areal coverage of green macroalgae in the entire Schleswig-Holstein (SH) Wadden Sea since 1995, also based on aerial surveys. Large interannual differences are apparent (Figure 9B) with high coverage observed in 2001 and a high, but lesser extent in 2006. Areal coverage was small in 1997 and 2004, and in 2012-2014, an unprecedented low extent has been observed.
Both time series demonstrate a decrease, but coverage remains at a higher level in the LS Wadden Sea as opposed to the extreme low coverage in the SH Wadden Sea. Given that both time series show a decreasing trend, it is tempting to correlate the coverage with riverine nutrient loads. In the last QSR this was done but the relation was only significant if one outlier (2001) was removed. Comparing both time series it is interesting to note that during the 1990s both time series displayed temporal synchrony with high values during the early 1990s, low values during the late 1990s and very high values during the early 2000s. This suggests that at least the high, early 2000 values are not to be regarded as an outlier as assumed in the QSR 2009 but are part of a complex, yet poorly understood interaction of several factors. The overall decrease is in line with decreasing riverine nutrient inputs, but a high growth potential is still present. It is unclear to what extent hydrodynamical, climatic, biogeochemical and biological factors interact to produce the high variability observed in green macroalgal coverage.
Figure 9. Left (A): Areal cover >20 % of green macroalgae in the Lower Saxon Wadden Sea (data: NLWKN, 2016); Right (B): Areal cover >20 % of green macroalgae in the Schleswig-Holstein Wadden Sea (Source: Dolch et al., 2015).
3. Assessment
Targets on the chemical quality of the Wadden Sea ecosystem were adopted at the Leeuwarden Conference (citation) and aim at natural levels of nutrient concentrations and nutrient input. They are prerequisite for a naturally developing phytoplankton and phytobenthos community. Background values of winter concentrations are used for the OSPAR assessments (e.g., OSPAR 2008).
The WFD assessment focuses on the eutrophication effects based on biological indicators but states that supporting elements, such as nutrients should have a good status if the biological quality status indicators are in good or high status. Important quality indicators are among others, phytoplankton biomass, seagrass distribution and green macroalgal blooms. High phytoplankton biomass, large areas with green opportunistic macroalgae or a decrease in seagrass are eutrophication indicators.
The three Wadden Sea countries can develop their own assessment, but these assessments should be intercalibrated. This process is not finalized yet. Here, subjective terms are avoided, such as “good” or “moderate” as used in the WFD but merely indicate the approximate deviation from background estimates.
3.1 Nutrients
Riverine background concentrations for European rivers were estimated at about 20-71 µM N (~0.6 mg/l N) and 0.7 - 4.5 µM P by Laane (1992). Brockmann et al. (2008) reported lower background values of about 20 µM (~0.3 mg/l N) for TN and about 0.5 µM for TP. Despite the large uncertainty in the riverine background estimates, the present values of about 250 µM N and 5 µM P are especially for N clearly elevated.
For the Dutch Wadden Sea, background DIN levels of 6.5 µM were used (Baretta-Bekker et al., 2008); for the German Wadden Sea, Brockmann et al. (2008) proposed DIN values of about 7-9 µM; and Andersen and Kaas (2008) used 11.5 µM for the Danish Wadden Sea. Compared to the present DIN winter concentrations of about 50 µM in most of the Wadden Sea, it is concluded that the Wadden Sea is still enriched (a factor of four to seven) compared to background DIN concentrations
For the Dutch Wadden Sea, background PO4 levels of 0.5 µM were used by Baretta-Bekker et al. (2008); for the German Wadden Sea, Brockmann et al. (2008) proposed PO4 values of about 0.4 µM; and Andersen & Kaas (2008) used 0.4 µM for the Danish Wadden Sea. Compared to the present DIP winter concentrations of about 0.5-1.6 µM, it is concluded that especially the central Wadden Sea is still enriched by a factor of four compared background PO4 concentrations, but reaches near background concentrations in the northern and western parts of the Wadden Sea. Despite the low winter concentrations substantial amounts of phosphorus are available in the sediment to sustain a high primary production (Ly et al., 2014).
3.2 Chlorophyll
The data analysis confirms the relation between riverine nutrient loads and phytoplankton stocks. The recent decrease in riverine nutrient loads is reflected by decreasing chlorophyll levels. The evaluation of present levels against background estimates is difficult because the three Wadden Sea countries use different estimates. As a rule of thumb, the following conversions can be used: Annual mean chlorophyll levels are about 20 % lower than summer chlorophyll levels (May-September; QSR 2010). 90-percentile values are about two times higher than mean values (e.g., Baretta-Bekker et al., 2008).
Background mean chlorophyll levels during the growth season (March-September) for the Dutch Wadden Sea are estimated at 8 µg Chla /l by Baretta-Bekker et al. (2008) but at a lower level of about 4 µg Chla/l by van Beusekom (2005). German estimates are almost two times lower and amount to 2-3 µg Chla/l. Danish background estimates of 1.9 µg Chla/l (May-September; Andersen & Kaas, 2008) and 4.0 µg Chla/l (May-September; Carstensen et al., 2008) are in the same range as the German estimates. In all areas, present values are higher than 4 µg/l. Taking the background values of Baretta-Bekker et al. (2008) the chlorophyll data from the western Dutch Wadden Sea are within the range of background values, but data from the eastern Dutch Wadden Sea (Dantziggat) are almost three times higher.
In the framework of the WFD, Denmark and Germany agreed on a good-moderate 90 percentile threshold of 7.5 µg Chla/l (a mean of about 3.8 µg Chla/l). Present values in the northern Wadden Sea are at least 50 % higher. No agreement has been reached yet on good-moderate thresholds between Germany and the Netherlands.
We conclude that the phytoplankton biomass in the Wadden Sea is up to a factor of about 3 above background levels but note the uncertainty involved in determining background values e.g., due to gradients within e.g., the Dutch Wadden Sea.
3.3 Green macroalgae
Green macroalgae are a symptom of eutrophication and are still observed to impact seagrass beds (e.g., NLWKN, 2016). Compared to the 1990s and early 2000s, the macroalgal coverage has decreased underpinning a general improvement of the eutrophication status. Whereas macroalgal coverage presently remains at a low level in Schleswig Holstein, fluctuations in Lower Saxony are still high, underlining a higher nutrient pressure stimulating the macroalgal growth potential. We conclude that especially in Lower Saxony green macroalgal coverage is above background levels. Note that methodologically comparable observations in the Netherlands and Denmark are missing, precluding a general Wadden Sea conclusion.
3.4 Target evaluation - summary
The eutrophication aspects discussed above all show that present levels are above background levels. However, background levels will probably never be reached and the main challenge remains to agree upon what are acceptable deviations from background values. This discussion bears potential conflicts between e.g., carrying capacity (enough food) and restoration of low levels of green macroalgal coverage (reduction of nutrient loads).
Given the data discussed in this report and given the report on seagrass (see seagrass report), five aspects indicate that further action is needed to reduce riverine nutrient and in particular riverine nitrogen loads.
- Both riverine and Wadden Sea winter N/P ratios are very high indicating an oversupply with nitrogen;
- According to the WFD assessment for the less eutrophic Danish-German Wadden Sea, Chla levels are moderate (with no agreement on the WFD assessment yet between the Netherlands and Germany for the more eutrophic southern Wadden Sea);
- Especially in the lower saxon Wadden Sea, a high potential for green macroalgal blooms is still present;
- Seagrass coverage in the southern Wadden Sea shows some signs of recovery (see seagrass report), but in contrast to the less eutrophic northern Wadden Sea, a clear improvement was not observed yet;
- Very high Chla values in the central Wadden Sea near the Elbe and in the Dutch Wadden Sea (Dantziggat) show that a high phytoplankton growth potential is still present.
4. Recommendations
4.1 Management
Current policies to reduce nutrient input were successful with regard to phosphorus and nitrogen compounds, but further reductions are necessary to reach the goal of a Wadden Sea without eutrophication effects. The decreasing nutrient loads into the coastal North Sea and directly into the Wadden Sea have led to a decreasing eutrophication status in the entire Wadden Sea indicated by decreasing nutrient concentrations and decreasing chlorophyll levels. In the northern Wadden Sea, seagrass has returned to levels as observed during the 1930s and green macroalgae have reached minimum extent. However, it should be kept in mind that nutrients are only one of the many factors that influence macroalgal and seagrass distribution. Specifically, Folmer et al. (2016) concluded that unknown factors regulate seagrass development in the southern Wadden Sea. The target of a Wadden Sea without eutrophication problems has not been reached yet. Therefore it is recommended to continue efforts to reduce nutrient input.
4.2 Monitoring and research
Importance of long time series
Long time series are the backbone of the assessment of eutrophication. In comparison to the last QSR, several time series stations in the Dutch Wadden Sea and in the Danish Wadden Sea were abandoned. Keeping up the remaining time series is of utmost importance for the eutrophication assessment.
Importance of coverage of the entire seasonal cycle
The present study was largely based on nutrient and chlorophyll data that cover the entire annual cycle with a resolution of about once a month and preferably more frequent during the growth season in order not to miss peaks in chlorophyll abundance. Not all monitoring programs possess the necessary spatial and temporal sampling resolution. Care should be taken that such data should be available in the future and that temporal and spatial resolution of monitoring programs is expanded.
New automated monitoring and remote sensing techniques
At present, techniques and strategies are developed in Germany and The Netherlands to implement automated monitoring stations. We suggest to stimulate international exchange of information and methods in order to establish a coherent Wadden Sea-wide automated monitoring network. Remote sensing is a strong tool to study regional differences in phytoplankton biomass on a Wadden Sea wide scale.
Regional differences within the Wadden Sea
The present study confirms the previous conclusion (QSR, 2010) on regional differences within the international Wadden Sea. Despite progress, a unifying concept explaining regional differences is still lacking but it is essential to formulate region-specific standards for a good ecological status, as demanded by the Water Framework Directive and Marine Strategy Framework Directive.
Interacting effects of regional and global climate change effects
During the past decade, the warming trend in the Wadden Sea area has become evident. This may have promoted the appearance of invasive species (QSR, 2009, Thematic Report No. 7: Nehring et al., 2009) (see report on alien species). Future research will have to tackle the question of how present trends (oligotrophication, warming, proliferation of invasive species, sea level rise) interact (Reise & van Beusekom, 2008) (see reports on climate change and climate ecosystems). Monitoring and assessment strategies have to adapt at an early stage to account for changes ahead as previous assessment strategies may not be appropriate any more.
Phosphorus versus Nitrogen limitation
In the present study, the temporal variations of eutrophication indicators were significantly correlated with riverine TN input. However, evidence suggests that at least part of the Wadden Sea (e.g., Western Dutch Wadden Sea), and at least part of the adjacent coastal zone is limited by phosphorus (e.g., Philippart et al., 2007; Burson et al., 2016). Ly et al. (2014) gave experimental evidence of a P (and Si) limited spring bloom whereas at least for the Northern Wadden Sea nitrogen limitation is assumed (e.g., Carstensen, 2008; van Beusekom et al., 2009). Research is needed to understand the regional differences in nutrient limitation patterns and their implications for the coastal ecosystem.
5. Summary
Rivers are the major source of Wadden Sea eutrophication. The nutrient inputs of the major rivers impacting the Wadden Sea continue to decrease at an average pace of about 2.5 % per year for TN and about 5.4 % per year for TP. During the past decade, the lowest inputs since 1977 were observed but these declining trends are levelling out, i.e., the TP trend has stagnated.
Phytoplankton biomass (measured as Chla) remains at a low level. In tidal inlet stations with a long-term monitoring, summer phytoplankton levels correlate with riverine TN loads but stations located within the Wadden Sea behave more complex. Regional differences are observed with highest levels in the southern Wadden Sea and in the mouth of the Elbe estuary and lowest levels in the northern Wadden Sea.
No standardized macroalgal monitoring is carried out. In Lower Saxony and Schleswig Holstein, macroalgal aerial monitoring is carried out. In Schleswig Holstein, the areal extent (>20 %) is decreasing and the observations from the last decade are clearly below the earliest observations. In Lower Saxony, present extent is below the earliest observations in the 1990s but interannual variation is large and not predictable from nutrient inputs.
The trilateral goal is to reach a Wadden Sea that can be regarded as a non-problem area with regards to eutrophication. The aim is to have good ecological status in the sense of the EU Water Framework Directive. Measures to reduce nutrient inputs in the past have led to a significant improvement of the eutrophication status. However, given that nutrient levels, N/P ratios, chlorophyll levels and macroalgal coverage still are clearly above background levels, we conclude that the goal of an eutrophication non-problem area has not been met yet. The aim of the WFD is to reach a good ecological status, not background levels. However, these targets are bilateral and not trilateral precluding a general WFD related assessment for the entire international Wadden Sea.
About the authorsJ.E.E. van Beusekom1, P. Bot2, J. Carstensen3, A. Grage4, K. Kolbe5, H.-J. Lenhart6, J. Pätsch7, T. Petenati8, J. Rick9 1 Helmholtz-Zentrum Geesthacht, Max-Planck-Strasse 1, 22502 Geesthacht, DE 2 Rijkswaterstaat Waterdienst, Postbus 17, 8200 AP Lelystad, NL 3 University of Arhus, Department of Bioscience, Frederiksborgvej 399, 4000 Roskilde, DK 4 Bundesamt für Seeschifffahrt und Hydrographie, Wüstland 2, 22589, Hamburg, D 5 Niedersächsische Landesbetrieb für Wasserwirtschaft, Küsten- und Naturschutz – Betriebsstelle Brake-Oldenburg Am Sportplatz 23, 26506 Norden, D 6 Universität Hamburg, Informatics, Bundesstraße 45a, 20146 Hamburg, D 7 University of Hamburg, IfM, Bundesstr. 53, 20146 Hamburg, D 8 Landesamt für Landwirtschaft, Umwelt und ländliche Räume des Landes Schleswig-Holstein, Hamburger Chaussee 25, 24220 Flintbek, D 9 Alfred-Wegener-Institut, Helmholtz-Zentrum für Polar-und Meeresforschung, Hafenstrasse 34, 25992 List/Sylt, D |
References
Baretta-Bekker, J.G., Bot, P.V.M., Prins, T.C. and Zevenboom, W. (2008) Report on the second application of the OSPAR Comprehensive Procedure to the Dutch marine Waters. Rijkswaterstaat, The Hague.
Beukema, J., and G. Cadée. (1996). Consequences of the sudden removal of nearly all mussels and cockles from the Dutch Wadden Sea. Marine Ecology 17:279-289.
Burson, A., M. Stomp, L. Akil, C. P. Brussaard, and J. Huisman (2016) Unbalanced reduction of nutrient loads has created an offshore gradient from phosphorus to nitrogen limitation in the North Sea. Limnology and Oceanography.
Cadée, G. C., and J. Hegeman (1974) Primary production of phytoplankton in the Dutch Wadden Sea. Netherlands Journal of Sea Research 3:240-259.
Carstensen, J. (2008) Estimation of nutrient reductions to achieve phytoplankton ecological targets in the Wadden Sea. NERI, Aarhus.
Carstensen, J., Krause-Jensen, D., Dahl, K. and Henriksen, P. (2008) Macroalgae and phytoplankton as indicators of ecological status of Danish coastal waters. National Environmental Research Institute, University of Aarhus. 90 pp. NERI Technical Report No. 683.
Colijn, F. (1982) Light absorption in the waters of the Ems - Dollard estuary and its consequences for the growth of phytoplankton and microphytobenthos. Netherlands Journal of Sea Research 15:196-216.
De Jong, F. (2007) Marine eutrophication in perspective: on the relevance of ecology for environmental policy. Springer Science & Business Media.
de Jong, F., K. Kolbe, and J. E. E. van Beusekom (1999) Anoxic Sediment Surface. Pages 121 - 123 in F. de Jong, J. F. Bakker, C. J. M. van Berkel, N. M. J. A. Dankers, K. Dahl, C. Gätje, H. Marencic, and P. Potel, editors. 1999 Wadden Sea Quality Status Report, Wadden Sea Ecosystem No. 9. Common Wadden Sea Secretariat, Trilateral Monitoring and Assessment Group, Quality Status Report Group, Wilhelmshaven.
de Jonge, V. N., and D. J. de Jong (2002) 'Global change' Impact of inter-annual variation in water discharge as a driving factor to dredging and spoil disposal in the river Rhine system and of turbidity in the Wadden Sea. Estuarine, Coastal and Shelf Science 55:969-991.
de Jonge, V. N., and H. Postma (1974) Phosphorus compounds in the Dutch Wadden Sea. Netherland Journal of Sea Research 8:139-153.
de Jonge, V. N., and J. E. E. van Beusekom (1995) Wind- and tide-induced resuspension of sediment and microphytobenthos from tidal flats in the Ems estuary. Limnology and Oceoanography 40:766-778.
Dolch, T., C. Buschbaum and K. Reise (2016) Bericht zum Seegras- und Grünalgenmonitoring im Schleswig-Holsteinischen Wattenmeer. Forschungbericht in Auftrag des Landesamt für Küsten- und Naturschutz
Duran-Matute, M., T. Gerkema, G. De Boer, J. Nauw, and U. Gräwe (2014) Residual circulation and freshwater transport in the Dutch Wadden Sea: a numerical modelling study. Ocean Science 10:611-632.
Folmer, E., J. E. E. van Beusekom, T. Dolch, U. Gräwe, M. M. van Katwijk, K. Kolbe, and C. J. M. Philippart (2016) Consensus Forecasting of Intertidal Seagrass Habitat in the Wadden Sea. Journal of Applied Ecology 53:1800-1813.
Froelich, P. N. (1988) Kinetic control of dissolved phosphate in natural rivers and estuaries: a primer on the phosphate buffer mechanism. Limnology and Oceanography 33:649-668.
Hickel, W. (1989) Inorganic micronutrients and the eutrophication in the Wadden Sea of Sylt (German Bight, North Sea). Pages 309-318 Proceedings of the 21st EMBS. Polish Academy of Science, Gdansk.
Hofmeister, R., M. Schartau, and G. Flöser (2016) Estuary-type circulation as a factor sustaining horizontal nutrient gradients in freshwater-influenced coastal systems. geo-marine letters 37:179. https://doi.org/10.1007/s00367-016-0469-z
Kolbe, K., E. Kaminski, H. Michaelis, B. Obert, and J. Rahmel (1995) Macroalgal development in the Wadden Sea: first experiences with a monitoring system. Helgoländer Meeresuntersuchungen 49:519 - 528.
Lancelot, C., G. Billen, A. Sournia, T. Weisse, F. Colijn, M. J. W. Davies, and P. Wassman (1987) Phaeocystis blooms and nutrient enrichment in the continental coastal zones of the North Sea. Ambio 16:38-46.
Loebl, M., F. Colijn, and J. E. E. van Beusekom. (2008) Increasing nitrogen limitation during summer in the List Tidal Basin (Northern Wadden Sea). Helgoland Marine Research 62:59-65.
Loebl, M., F. Colijn, J. E. E. van Beusekom, J. G. Baretta-Bekker, C. Lancelot, C. J. M. Philippart, V. Rousseau, and K. H. Wiltshire (2009) Recent patterns in potential phytoplankton limitation along the Northwest European continental coast. Journal of Sea Research 61:34-43.
Loebl, M., T. Dolch, and J. E. E. van Beusekom (2007) Annual dynamics of pelagic primary production and respiration in a shallow coastal basin. Journal of Sea Research 58:269-282.
Ly, J., C. J. Philippart, and J. C. Kromkamp (2014) Phosphorus limitation during a phytoplankton spring bloom in the western Dutch Wadden Sea. Journal of Sea Research 88:109-120.
NLWKN, (2016) Überwachung von Makroalgen im niedersächsischen Wattenmeer - Datenzusammenstellung 1990 bis 2015 Dienstbericht NLWKN Betriebsstelle Brake-Oldenburg, 27 S.
Pätsch, J., and H.-J. Lenhart, editors (2004) Daily Loads of Nutrients, Total Alkalinity, Dissolved Inorganic Carbon and Dissolved Organic Carbon of the European continental Rivers for the Years 1977 - 2002. Berichte aus dem Zentrum für Meeres- und Klimaforschung. Reihe B: Ozeanographie, Nr 48.
Philippart, C. J. M., J. M. van Iperen, G. C. Cadee, and A. F. Zuur (2010) Long-term Field Observations on Seasonality in Chlorophyll-a Concentrations in a Shallow Coastal Marine Ecosystem, the Wadden Sea. Estuaries and Coasts 33:286-294.
Postma, H. (1954) Hydrography of the Dutch Wadden Sea. Archives néerlandaises de Zoologie 10:405-511.
Postma, H. (1966) The cycle of nitrogen in the Wadden Sea and adjacent areas. Netherlands Journal of Sea Research 3:186-221.
Radach, G., and J. Patsch (2007) Variability of continental riverine freshwater and nutrient inputs into the North Sea for the years 1977-2000 and its consequences for the assessment of eutrophication. Estuaries and Coasts 30:66-81.
Reise, K. (2008) Vorkommen von Grünalgen und Seegras im Nationalpark Schleswig-Holsteinisches Wattenmeer. Report Landesamt für Küsten- und Naturschutz, Tönning, Germany.
Reise, K., and I. Siebert (1994) Mass occurrence of green algae in the German Wadden Sea. Deutsche Hydrographische Zeitschrift 1:171 - 188.
Reise, K., and J. E. van Beusekom (2008) Interactive effects of global and regional change on a coastal ecosystem. Helgoland Marine Research 62:85-91.
van Beusekom, J. E. E., H. Fock, F. de Jong, S. Diel-Christiansen, and B. Christiansen (2001) Wadden Sea specific eutrophication criteria. Wadden Sea Ecosystem 14:1-115.
van Beusekom, J. E. E., M. Loebl, and P. Martens (2009) Distant riverine nutrient supply and local temperature drive the long-term phytoplankton development in a temperate coastal basin. Journal of Sea Research 61:26-33.
This report should be cited as: van Beusekom, J. E. E., Bot, P., Carstensen, J., Grage, A., Kolbe, K., Lenhart, H.-J., Pätsch, J., Petenati, J., & Rick, J. (2017). Wadden Sea Quality Status Report: Eutrophication (1.01). Common Wadden Sea Secretariat. https://doi.org/10.5281/zenodo.15198149
All 2017 reports may be cited collectively as: Kloepper, S., Baptist, M. J., Bostelmann, A., Busch, J.A., Buschbaum, C., Gutow, L., Janssen, G., Jensen, K., Jørgensen, H.P., de Jong, F., Lüerßen, G., Schwarzer, K., Strempel, R., & Thieltges, D. (2017). Wadden Sea Quality Status Report. Common Wadden Sea Secretariat, Wilhelmshaven, Germany. Downloaded DD.MM.YYYY. qsr.waddensea-worldheritage.org

