
Annex "Fish" (2017)
Fish portrait: Herring
Andreas Dänhardt
There is no doubt that herring play an important role in the Wadden Sea ecosystem. Due to the sheer biomass of juveniles arriving in spring from their spawning grounds along the British east coast and in the English Channel (Corten, 2002; Dickey-Collas, et al., 2009), herring is a critical element in the food web as consumer and prey alike (Dänhardt & Becker, 2011). The arrival of smaller individuals and the emigration or selective mortality of larger specimen within a cohort can result in an almost static length distribution over several weeks in summer (Dänhardt & Becker, 2008). Avian top predators such as terns have adapted their breeding phenology to the seasonal occurrence of the juvenile herring (Dänhardt, 2010).
It is less well known how important the Wadden Sea is for herring. Spawners, eggs, larvae and juveniles occur in large quantities, following a more or less predictable seasonal sequence, while relative abundance of post-egg stages increases with distance to the coast (Dänhardt, 2016). The relative contribution to coastal herring populations of a spring-spawning population component in the Wadden Sea (Picture A.1) is largely unknown. The majority of post-larval and juvenile herring entering the Wadden Sea early in the year are spawned in winter in the English Channel by the so-called Downs spawning stock (Schareck, 2013). Herring spawn in discrete locations, with peak spawning occurring successively later from north to south (McQuinn 1997). After hatching, the larvae start to disperse and the growing juveniles drift eastward into the Wadden Sea with the residual current in the southern North Sea (Otto et al., 1990; Dickey-Collas et al., 2009). In some years, juveniles also from the Banks spawning stock off the Humber estuary utilize the Wadden Sea as a nursery (Tiews, 1961; Munk & Christensen, 1990). The relevance of the Wadden Sea for recruitment of herring juveniles to the adult population has yet to be clarified.
Life history traits of herring are highly dynamic, varying mainly with regard to reproductive parameters such as spawning season, egg size and spawning areas (van Damme et al., 2009; Geffen, 2009; Dickey-Collas et al., 2015). Herring release their eggs on clean and coarse bottom substrates (Dickey-Collas et al., 2015), or they attach their spawn to hard substrate such as algae (Picture A.1), seagrass or man-made structures. The latter behaviour is dominant in the Wadden Sea and in the Baltic. As herring pack their eggs in rather thick layers on top of each other (Picture A.1 c & d), continuous supply of well-oxygenated water is critical for egg survival and development. Therefore, the requirements herring have with regard to their spawning habitat appear to be quite specific (Polte et al., 2006) and make them vulnerable against impacts affecting seabed integrity and oxygen levels. During most of their entire post-hatch life, they are strictly pelagic.
The transition from internal (yolk sac) to external (zooplankton) feeding has been identified as a major bottleneck for population development (Payne et al., 2009; Gröger et al., 2010). Patterns of recruitment variability arising from differential larval survival rates are detectable in life history parameters of higher trophic levels such as fish-eating seabirds breeding in the Wadden Sea (Dänhardt & Becker, 2011). The functional processes and ecological pathways shaping predator-prey relationships across spatial and temporal scales are still under debate. Resolving them is the prerequisite to evaluate abundance trends and identify management options.
 Picture A.1: Herring in the Wadden Sea. a) Spawner (top) and 1-year old juvenile (bottom) caught in April 2013 in the Jade Bay, b) Stow net clogged up with herring larvae in April 2016, c) Beds of brown algae attached to blue mussels carrying dense carpets of d) herring eggs. Pictures c) and d) courtesy of Heike Büttger.
Fish portrait: North Sea houting
Niels Jepsen
The North Sea houting (Coregonus oxyrinchus) is an endangered anadromous salmonid belonging to the European lake whitefish complex. This fish species is endemic to the Wadden Sea and not found elsewhere. The houting start their life in the river, but already after few weeks the juveniles migrate to the sea, where they spend most of their life. They grow to a size of 50-60 cm, live up to 10 years and undertake spawning migration into the rivers every year in winter. Once an abundant fish species in the rivers of the Wadden Sea, the North Sea houting was at the brink of extinction 25 years ago. The very last stronghold for this species was in the small Danish River Vidå. In an attempt to preserve this species, juveniles were hatchery-reared and stocked in six rivers flowing into the Wadden Sea in 1987-1992. The stocking was successful and the houting did establish populations in at least two of the rivers, but the underlying problem of habitat degradation and migration obstacles were not solved. Since a national management plan was issued in 2003 in Denmark, large scale river restoration measures have been undertaken including the removal of 13 large obstacles in three rivers and reestablishment of meanders in the lower river reaches, all measures intended to increase the spawning area for houting and reduce juvenile mortality. Unfortunately, the population of houting is still decreasing, probably because of an increased predation pressure from cormorants, due to changed foraging behavior and increased number of overwintering birds.
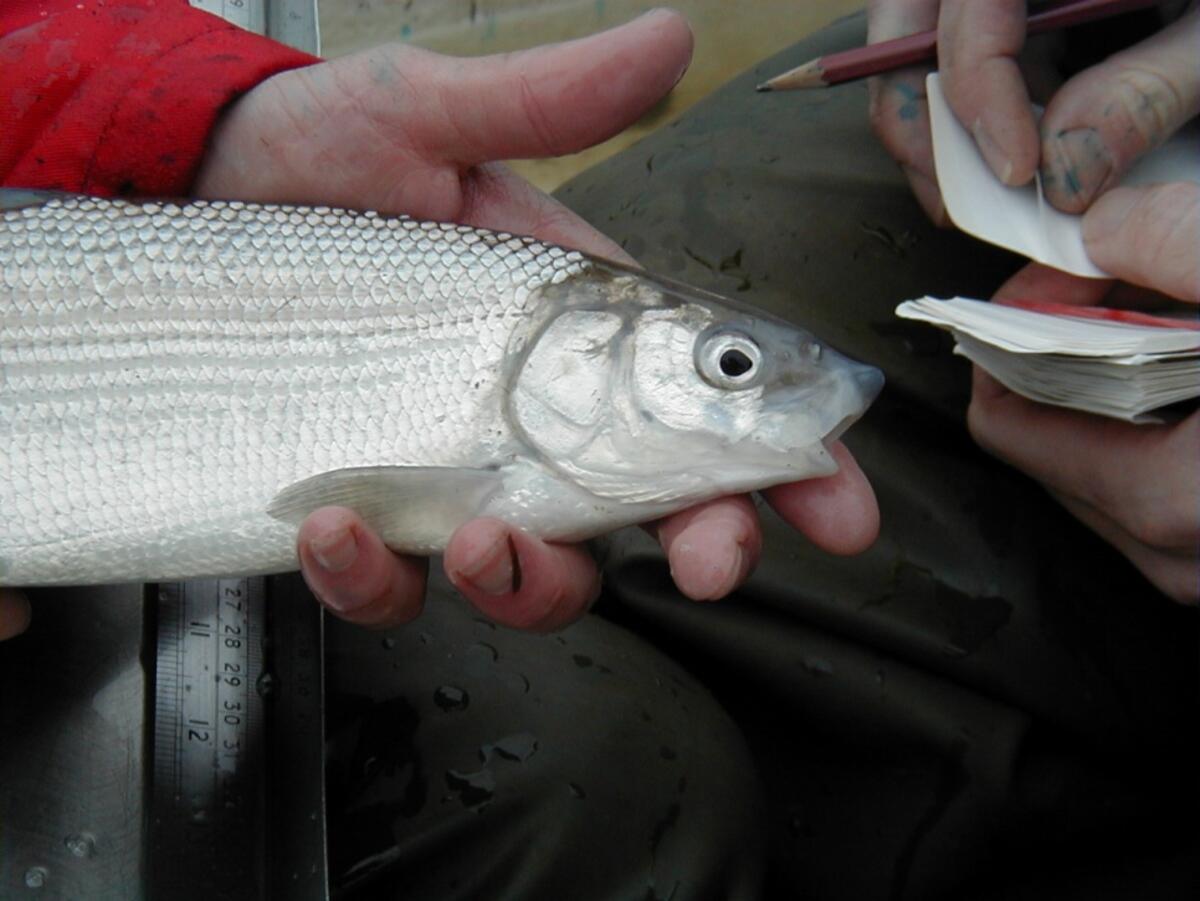 Picture A.2. North Sea houting (Coregonus oxyrinchus) .
Fish portrait: plaice
Ingrid Tulp
Plaice is one of the most common flatfish species in the Wadden Sea. The spawning grounds are offshore and the planktonic eggs and larvae drift towards the coast. They arrive as postlarvae in the coastal waters and then use selective tidal transport (they move to midwater during the flood tide and settle at the bottom during ebb) to migrate further inshore and into the Wadden Sea (Bolle et al., 2009; van Beek et al., 1989; Zijlstra 1972). They settle in large numbers as 0 group fish with a distinct peak in June (van der Veer 1986; Zijlstra et al., 1982). The juveniles have a preference for fine sandy sediments that allow them to bury themselves and hide for predators. Once in the Wadden Sea they move with the flood tide on the tidal flats and are carried back in the channels during ebb tide (van der Veer 1986; Zijlstra et al., 1982). In recent years, however, although settlement of 0 group plaice still occurs in the intertidal, shortly thereafter they move into the deeper channels within the Wadden Sea (Freitas et al., 2016). Formerly, also the one and two year old plaice used the Wadden Sea to grow up, but since ca. 2000, only 0 group plaice occur in the Wadden Sea. The disappearance of the older year classes and the different utilisation of the area by 0 group plaice is likely related to the rising summer seawater temperatures, which makes the Wadden Sea less suitable to grow for this cold water species (Teal et al., 2012). The adult population in the North Sea is currently doing very well, with the highest stock biomass in the past 50 years. So, apparently the one and two year olds found alternative areas to grow up. In the Wadden Sea juveniles feed on regenerating parts of invertebrates such tail tips of the lugworm and siphons of bivalves (de Vlas, 1979). Juvenile plaice is bycaught in the shrimp fisheries and especially in spring, bycatches can be large. The effect of the bycatch of juveniles on the adult stock was recently enumerated as a reduction of 12-17 % (van der Hammen et al., 2015).
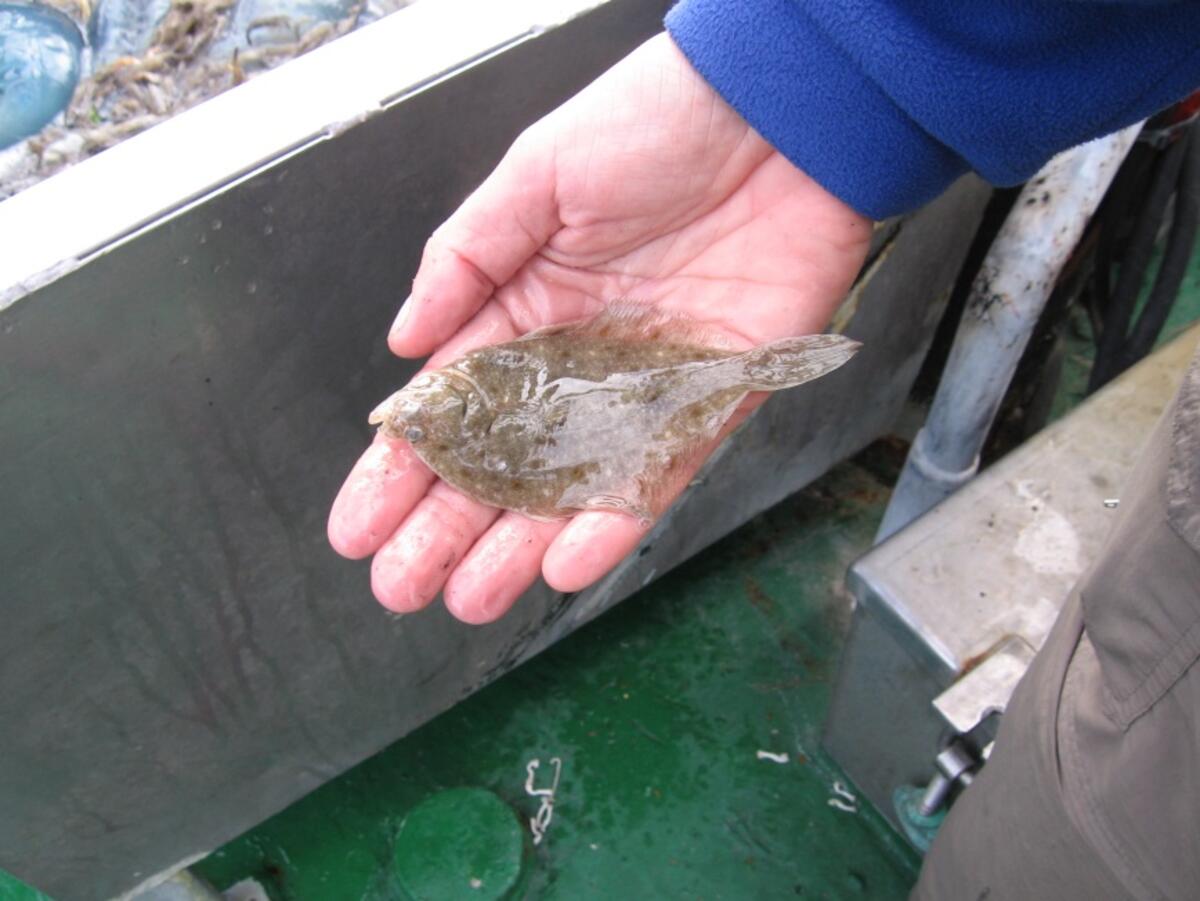
Picture A.3. A juvenile plaice.
Annex 1. Fish monitoring programmes
Table A1.1. Contact information for the fish monitoring programmes included in the QSR.

DFS (beam trawl)
The Dutch Demersal Fish Survey (DFS) covers the coastal waters (up to 25 m depth) from the southern border of the Netherlands to Esbjerg, including the Wadden Sea, the outer part of the Ems-Dollard estuary, the Westerschelde and the Oosterschelde (van Beek et al., 1989). This survey has been carried out in September-October since 1970 (September in the Wadden Sea). The number of hauls and the area swept was kept as constant as possible. In several years, not all sampling points were sampled due to adverse weather conditions. Sample locations were stratified by depth. For each haul, the position, date, time of day and depth were recorded. Within the Wadden Sea, sampling was carried out with a 3 m-beam trawl. The beam trawls were rigged with one tickler chain, a bobbin rope, and a fine-meshed cod-end (20 mm). Fishing was restricted to the tidal channels and gullies deeper than 2 m because of the draught of the research vessel. The combination of low fishing speed (2-3 knots) and fine mesh size results in selection of the smaller fish species and younger year classes. The mean abundance per area was calculated for the period 1970-2014 weighted by surface area for five depth strata (intervals of 5 m) within the region. Surface areas of depth strata used were taken from ICES (2011).
DYFS (beam trawl)
The German Demersal Young Fish Survey (DYFS) has been carried out in September-October since 1974 in the Wadden Sea areas of the Elbe estuary, Northern and Eastern Frisia by commercially chartered fishing vessels. A 3 m beam trawl with a mesh opening of 20 mm (stretched mesh) was used as the standard fishing gear. The number of sampled stations increased over the years from a minimum of about 100 stations in early years up to approximately 160 stations per season. The 15-min tows were carried out with the prevailing tidal current at a towing speed of approximately three knots. Fishing depth usually ranged from 2 to 15 m. The gear used in the surveys carried out by the two countries, The Netherlands and Germany, differ slightly. Only in the Dutch DFS a tickler chain is used.
AWI (beam trawl)
Between 1993 and 2007 a 3 m beam trawl (mesh size 10 mm, with tickler chain) similar to the standard gear of the DYFS was used to sample fish and epibenthic invertebrates in subtidal creeks behind the Lower Saxony Wadden Sea islands Spiekeroog and Langeoog (Knust et al., 2013). In this period, a total of 55 campaigns were carried out in March and July in the majority of years. Average haul duration was 10 minutes, average water depth was 4 m. If possible, sampling took place within two hours before and after low water. For effort standardization, the geographical position at veering and lifting the net were noted as endpoints of the linear sampling transect, from which the swept area was calculated. Catch numbers of individual hauls were then standardized to n * 1000 m-2 swept area. Whole catches were weighed, sorted by species and subsamples were taken as required after rechecking the catch for rare species. Samples were frozen for subsequent analyses in the laboratory, where total length to the nearest mm and wet weight to the nearest 0.01 g were determined. Abundance data for the trend analyses were calculated as the average catch numbers per unit effort of the individual species per month for any given year.
NIOZ (fyke)
Since 1960, a kom-fyke trap has been operated at the entrance of the Marsdiep basin in the western Dutch Wadden Sea. The kom-fyke is a passive gear consisting of a 200 m long and 2 m high leader which starts above the high water mark and ends in two chambers in the subtidal region with a mesh-size of 10 x 10 mm. Fishing normally started in March - April and lasted until October. In winter the trap was removed because of possible damage by ice floes and from 1971 onwards no fishing took place during part of the summer because of fouling of the net and clogging by macroalgae and sometimes by scyphomedusae.
Usually, the kom-fyke was emptied every morning, except when bad weather prevented this. Pre-1973 the nets were sometimes emptied on alternate mornings, when catches were small.
Samples were selected according to the following criteria:
Fishing duration less than 48 h and longer than 12 h, no damage of the gear upon retrieval (loose mesh panels or tears) and/or not clogged with debris. All catches were sorted immediately and identified to species level. For each species, numbers were counted and sometimes, when numbers were large, only wet mass was determined.
IMARES (fyke)
Diadromous fish abundance is monitored since 2001 during three months in spring/summer and three months in fall/winter in a fyke program at the Wadden Sea side of the Afsluitdijk near the sluices of Kornwerderzand. The program is carried out with five fykes in the discharge basin and two along the Afsluitdijk. They are lifted twice a week by professional fishermen and the catch is counted and registered per species. All catches were sorted immediately and identified to species level. For each species, numbers were counted and classified in two size classes (large and small, with the division at commercial landing size for commercial species and for other species at intervals roughly separating mature from immature fish).
Jade (stow net)
A ship-based stow net was employed in the central Jade Bay in the Lower Saxony Wadden Sea, Northern Germany between 2006 and 2015. Stow nets are passive fishing gear utilizing the water movement in rivers or in tidal marine areas such as the Wadden Sea. They target mainly pelagic fish by stretching between the water surface and the bottom. The rising tide lifts the vessel with the attached stow net from the ground, rendering the method inappropriate for targeting demersal species. Dänhardt & Becker (2011) and Breckling & Neudecker (1994) describe the method in detail. Between April and August at least one monthly campaign was carried out to cover the reproductive season of common terns Sterna hirundo breeding at the Jade. One haul during ebb and flood tide during the day and at night, respectively, were carried out, amounting to four hauls per campaign, but depending on local wind conditions, sometimes campaigns had to be terminated already after two or three hauls.
Net opening in 2006 and 2007 was 5 × 7 m divided into five compartments and a mesh size of 5 mm in the codend (Daenhardt & Becker, 2011), from 2008 on a larger net with only one instead of five chambers was used with a net opening of 7 × 7 m and 10 mm mesh size in the codend. Despite these differences the length distribution of the species used in the trend analyses did not differ significantly between the two gears, but differences in catch properties cannot be ruled out. The filtered water volume was calculated by multiplying the surface area of the net opening with current measurements obtained from mechanical propeller flowmeters (Hydrobios, Kiel). Absolute catch numbers were standardized to fish caught per 10,000 m3 filtered water volume. The catches were sorted by species, individuals from each species were counted and individual standard length measured to the nearest mm. The wet weight per species was determined on board to the nearest 2 g. Abundance data for the trend analyses were calculated as the average catch numbers per unit effort of the individual species per campaign for the years 2006-2015. For analysing the abundance trends, data were selected from months that were regarded most suitable to represent the phenology of the target species (herring, sprat and anchovy: end of June; twaite shad and river lamprey: April and August; smelt: June and August). For pilchard, sea bass and sea lamprey there were too few records to consider these species in the trend analyses.
Salt marshes (fyke)
Data on fishes in intertidal saltmarsh creeks were taken from two research projects employing the same methodology.
1. Fine-meshed (6 mm in the codend) fyke nets were placed in two intertidal creeks draining a saltmarsh in Dieksanderkoog Nord, Schleswig-Holstein, Northern Germany (54°01’00 N, 8°50’24 E). During four 5 day-campaigns in October 2010, May, June and August 2011 nine hauls per fyke per campaign were carried out to investigate structure and species composition of the fish community and species-specific abundance and size distribution. Repeatedly sampling a small water volume yielded dependent data, but allowed inferences on temporal utilization patterns by means of depletability and recolonization of the creeks by fish.
2. Between March 2015 and February 2016 four fyke nets were employed in four intertidal creeks off St. Peter Ording/ Ehst (54°16’40 N, 8°41’06 E), two of which draining a grazed part of the marsh, the other two draining ungrazed areas. Monthly fyke samples (one day and night in each of the four creeks) yielded data on structure and species composition of the fish community and species-specific abundance and size distribution. Samples of both surveys were processing according to the standard procedure of the stow net catches described above. Exact effort standardization was not possible, catch numbers were expressed as individuals per haul, assuming constant effort of the same fyke throughout the season.
Oyster reefs (fyke)
For the purpose of investigating how a newly introduced habitat is utilized by native fauna, five fine-meshed fyke nets (6 mm in the codend) were placed in three small creeks draining the surface of an intertidal reef of the Pacific oyster Crassostrea gigas, and in another two larger creeks surrounding the reef. The Pacific oyster reef (53°38'77 N, 8°15'99 E) is located near the end of a tidal channel called Kaiserbalje on a intertidal mud- and sandflat area between the Jade and the Weser estuary called Hohe Weg. In May, June and September 2014 two hauls per fyke (one during the day, the second during the night) were carried out. Fykes were set at low tide, catches were recovered at two subsequent low tides and processed according to the standard procedure of the stow net catches described above. For reference, stow net catches from a station 18 km further south of the reef location were carried out within a week of the fyke sampling on the reef (see above).
Schleswig-Holstein (stow net)
From an anchoring vessel a fine-meshed net (8 mm in the cod-end) is placed into the tidal currents between the water surface and the bottom by means of two iron beams, each 9 m long (= width of the net opening). Depending on the water depth the maximum net opening is 90 m².
The stow net is opened once the water current exceeds 1 m/s. When the current speed falls below this value the net is closed (by lifting the lower beam), terminating the haul. Thus, haul duration varies depending on local conditions and is highly influenced by wind and moon phase. Typical haul duration is 2 to 4 hours in which 0.2 to 0.5 mio. m³ of water pass through the net. Each sampling station is fished 4 times per 24 hours under the aspects of day and night as well as flood and ebb tide.
During each haul the current speed is measured by means of a Doppler current sensor in order to exactly calculate the catch volume. Absolute fish numbers and biomass by species are normalized to 1 mio. m³.
This monitoring programme started in 1991 in the Meldorf Bight. Three sites in the Meldorf Bight were sampled once a year in August. From 1997 to 2001 additional samples were taken in June in order to get more insight in seasonal variations of the fish fauna. Since 2001, the fish monitoring in August has been expanded to another three sampling sites in the Hörnum Deep, a tidal channel between the islands of Sylt and Amrum.
German rivers (stow net)
Annual fish monitoring has been carried out in the Elbe since 2000. After implementation of the WFD, monitoring was carried out in all German estuaries since 2006. The data form the basis for fish-based assessment of the ecological potential of the estuaries (Scholle & Schuchardt, 2012). Commercial stow net vessels are used. The stow net sizes vary according to the vessel between 90 m² - 130 m² with a mesh size of 8-12 mm in the cod-end. As a rule, the duration of a haul extends over the entire tidal phase (low and high tide phase), i.e. for several hours. The spatially defined catch stations reflect the different estuarine salinity zones from the freshwater section to the polyhaline zone of the outer estuary and a catch station has been set up in each salinity zone. Depending on the estuary, monitoring takes place twice a year in spring (May) and autumn (Sept./Oct.) each year, every other year or every third year (Table 1).
Catch data were standardized to ind.*100,000 m-3. The smelt data were differentiated into age group AG 1+ (adult, subadult) and AG 0+ (juvenile). Evaluation of AG 1+ is derived from spring catches while autumn data from transitional waters (T1) were used for the juvenile group (AG 0+). The data were spatially averaged for the specific estuary via the salinity gradient and provision of the standard error (= standard deviation divided by the square root of N fishing operations). Evaluation of the twaite shad data here was restricted to the age group AG 2+ (adult) and, thus, to the spawning stock.
Table A1.2: Database estuarine fish monitoring (Netherlands and Germany).
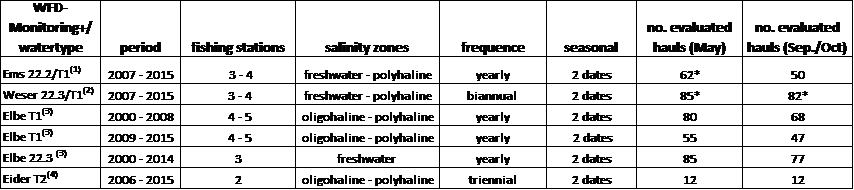
(1) = data LAVES, Department of Inland Fisheries in Lower Saxony, Rijkswaterstaat, IMARES; (2) data LAVES, Senator of Construction, Environment and Transport, Bremen, Bremenports, (3) = ARGE Elbe, FGG Elbe; (4) = State Office of Agriculture, Environment and Rural Areas, Schleswig Holstein. T1/T2 = transitional waters, 22.3 = tidal marshland stream (estuarine freshwater sections). * = incl. additional comparable data.
Danish rivers (multiple methods)
Salmon: In Varde å and Ribe å, the number of spawners is estimated from tagging – recapture surveys, where a large proportion of the adult salmon are captured by electro-fishing in October, PIT tagged and released. On the subsequent sampling in Nov/Dec, the ratio of tagged-to-untagged fish enables a solid estimate of the run. Factors like size-, age- and sex distribution and the wild/hatchery ratio are also provided from these studies. Each river is evaluated with two to three years interval. In addition, Sneum å was surveyed in 2015 and Kongeå will be surveyed in 2017. Detailed catch data from angling are available from all salmon rivers, where every caught fish (including released) should be reported. In Varde å and Ribe å, an inventory of spawning and rearing habitat and density of salmon juveniles has been carried out in 2015 and 2016.
Sea trout: No monitoring of the annual run of spawners. Some records of angler catch, but not as detailed as for salmon. All the rivers (even small creeks) are being surveyed regularly in August for the density of (mainly juvenile) trout. DTU Aqua has a national network of monitoring stations (app 6000), where 50 m river stretches are being sampled and all fish recorded. Each year about 1,000 stations are surveyed. Thus, we have long time series of data from many stations and can use these to evaluate trends and status for the population of sea trout.
Eel: According to the EU eel management plan (2007), member states must monitor the recruitment of eels. In DK, we have two stations that capture glass eels and we also monitor three streams every year for glass eel density. None of these are in the Wadden Sea area. In Ribe å there is annual monitoring of the output of silver eels, and time series are available five years back.
North Sea houting: This rare fish is being monitored only at the adult stage, upon return to rivers for spawning. Juveniles drift out into the Wadden Sea when only few cm long, so monitoring is difficult. Some tests have been conducted and nets sampling downstream drifting fish have caught juveniles of North Sea houting, but not consistently. The North Sea houting moves into the rivers for spawning in late fall and monitoring takes place using gill-nets and electro-fishing. Regular monitoring is carried out in Ribe, Varde and Vidå.
River lamprey: Juveniles of river lamprey cannot readily (in the field) be distinguished from brook lamprey, therefore monitoring is focused on adults. Likely habitats are pointed out (often downstream impassable obstacles) and electrofishing from boat or by wading is done in March/April. Direct observation of spawning lamprey is also registered.
Sea lamprey: In the case of sea lamprey, monitoring is based on juveniles. Sampling by netting is performed in the most likely habitats (and places where adult sea lamprey has been observed). A standard net 25 × 25 cm (DVFI-ketsjer) with meshsize 1.0 mm is used to drag through fine substrate, where larvae normally reside. Sampling is done in June-Oct. Presence/absence is recorded in a number of fields/squares/stations.
In the Wadden Sea area, Varde å, Kongeå, Ribe å, Vidå and Sneum å are being sampled for both River and Sea lamprey, but the monitoring is not fully operational yet.
Annex 2. Standardised trend analyses
Annual indices
Annual indices of catch per unit of effort (CPUE) were calculated for each survey. The CPUE in the beam trawl surveys was numbers per 10,000 m2. For the fyke series, the CPUE was expressed as numbers per fykeday. For the stow net data, the CPUE used was numbers per 10,000 m3.
For the DFS, the mean CPUE per region was weighted by surface area for five depth strata (intervals of 5 m) within the region. Surface areas of depth strata were taken from ICES (2011). For the DYFS and AWI data, no depth stratification was applied.
Some of the monitoring programmes were carried out several times per year. In most of these cases, the most appropriate period (per species) was selected.
Trend analyses
Time series of the species occurring in the Wadden Sea (Table 1) were analysed using Trendspotter (version 6.4), a computer program based on structural time-series analysis (Harvey, 1989) in combination with the Kalman filter (Visser, 2004). The Kalman filter algorithm operates recursively on streams of noisy input data to produce a statistically optimal estimate of the underlying system state (Kalman, 1960). The program is used to identify periods with significant increases or decreases beyond annual fluctuations, by estimating smoothed population numbers for a time series with N equidistant measurements over time. TrendSpotter also estimates the standard deviations of the smoothed population numbers. Finally, it estimates the standard deviations of the differences between consecutive time points. The estimation of confidence intervals is based on the deviations of time point values from the smoothed line. A more detailed description of the method can be found in Visser (2004) and Soldaat et al. (2007).
This method accounts for serial correlation and provides confidence limits to test for changes in abundance. We used the trend classification according to Soldaat et al., (2007) and distinguished among strong increase, moderate increase, stable, moderate decline, steep decline and uncertain. A yearly change rate of 1.00 means no change. A strong increase is characterised by a yearly change rate of at least 1.05 (5 % increase per year), while the lower confidence limit is no less than 1.05. Similarly a steep decline is characterised by a yearly change rate ≤0.95, with the upper confidence limit ≤0.95. A moderate increase has a lower confidence limit between 1.00 and 1.05 and a moderate decline has an upper confidence limit between 0.95 and 1.00. In stable trends the confidence interval includes 1.00 and lower CL ≥0.95 and upper CL ≤ 1.05. Uncertain trends have a confidence interval containing 1.00 and the lower CL < 0.95 OR upper CL > 1.05. When the number of years with mean catches of 0 or missing values was >25 % of the total number of years, no trend results and statistics were given as the method is not suited for such cases. In general the lower the year-to year variation, the smaller the confidence limits, the smoother the trendline follows the individual year values. Densities were 4th root transformed before analyses because of non-normality.
The assumptions of the model were tested in a systematic way for each species/area combination. The assumptions of the model are:
- The residuals follow a normal distribution;
- The variance is constant over time (homoscedasticity);
- There is no autocorrelation in the residuals.
These assumptions were tested after model fitting using the Breusch-Pagan test for heteroscedacity, the Shapiro-Wilk test for normality applying a p-value of 0.05. Autocorrelation was tested based on whether the autocorrelation of the residuals was within the confidence limits.
Explanation of the plots
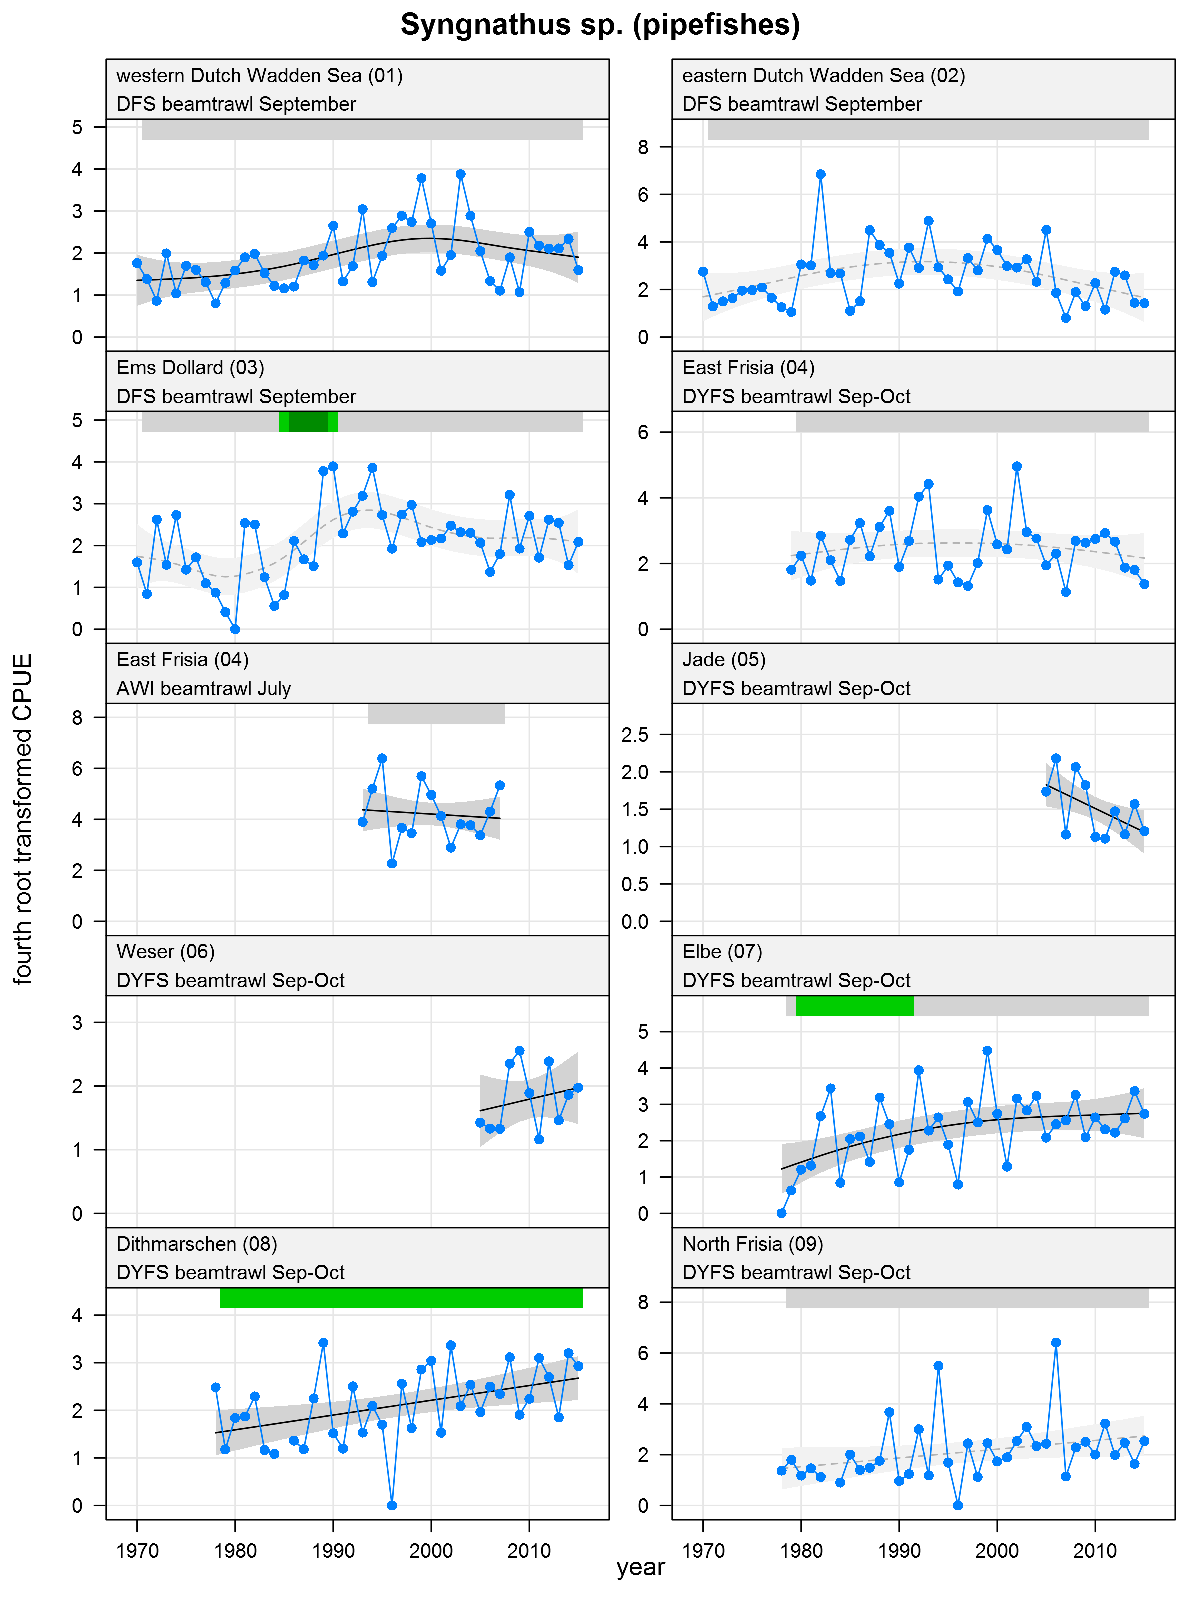
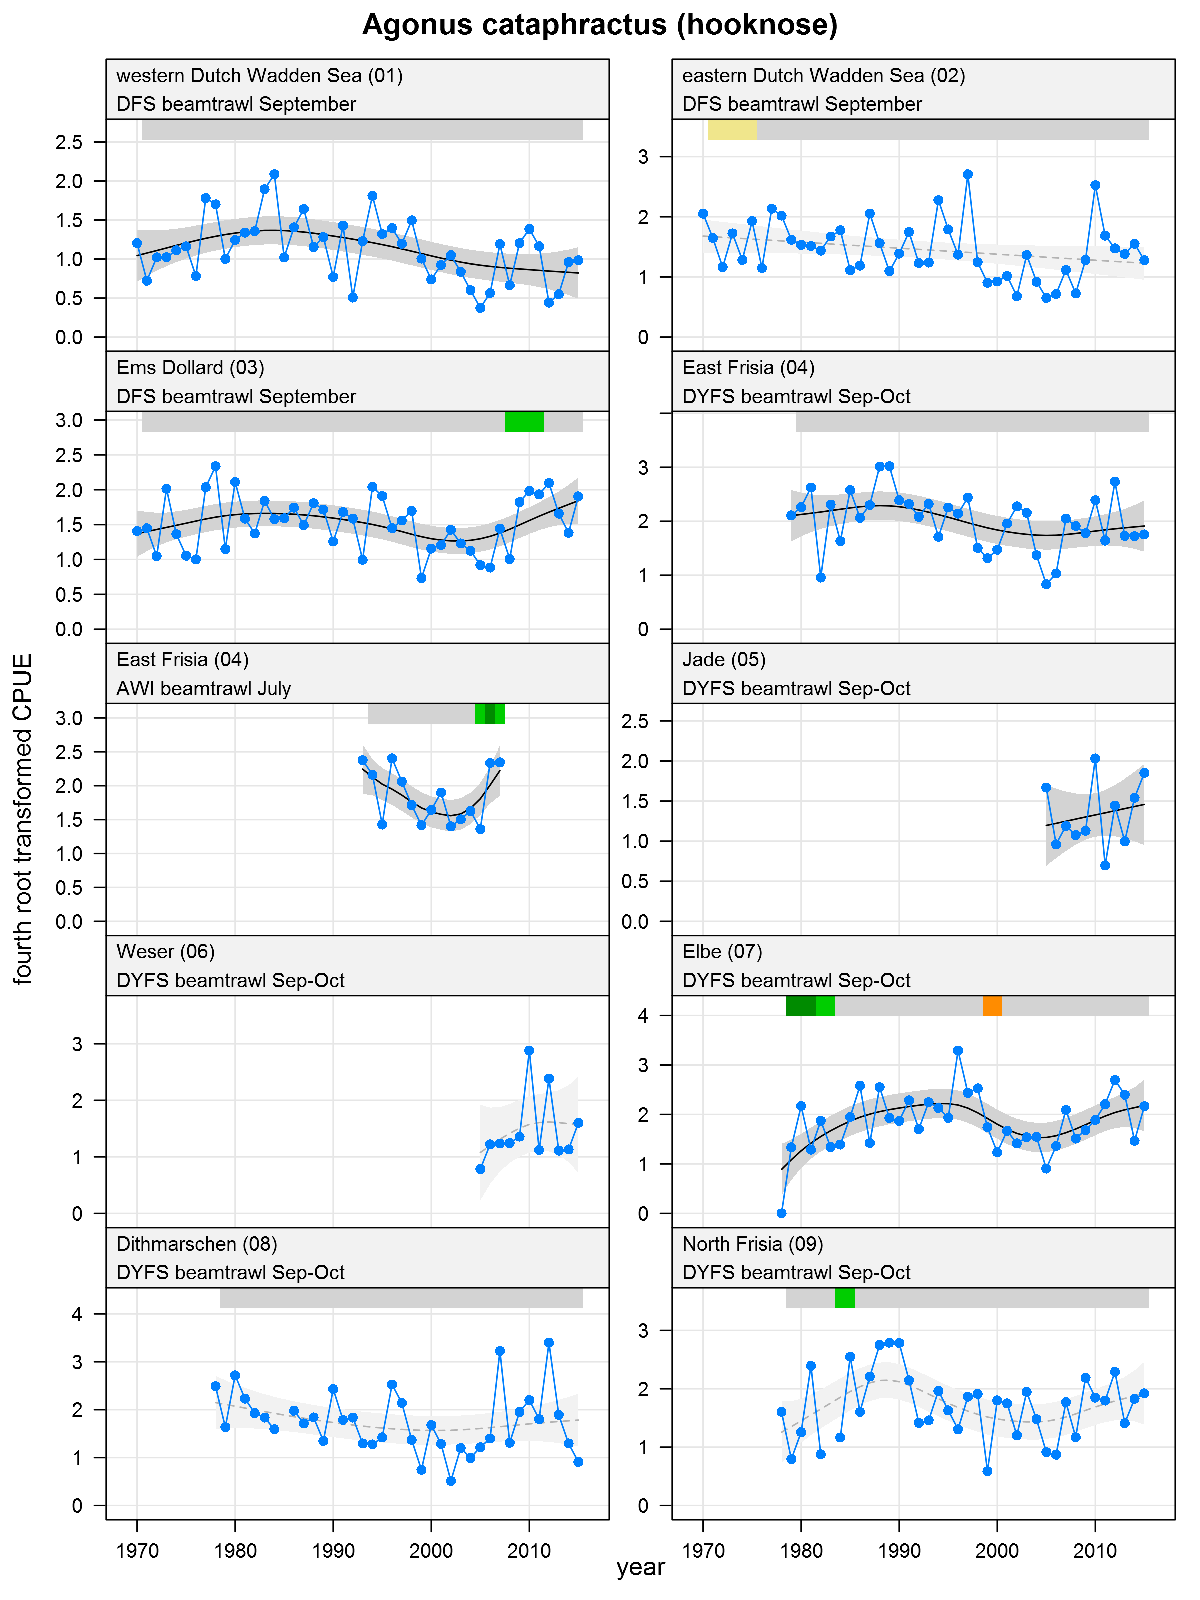
The plots show trends of (4th root transformed) CPUE by species, area and survey. The dots represent annual CPUEs, the line indicates the mean trend, the grey region the 95 % confidence intervals. Dotted lines are used for trend models that do not meet all statistical criteria. For time series of at least 15 years a trend classification is given: dark green=strong increase, green=moderate increase, red=strong decrease, orange=moderate decrease; yellow=stable, grey=uncertain. (See Annex 2 for further clarification on the trend analysis, trend classification and statistical criteria). Yearly change rates are not presented.
Annex 3. Trend plots and tables

Marine juveniles vs. estuarine residents: Mean normalised trends of six marine juvenile and six resident species in the Dutch and German Wadden Sea beam trawl surveys.
 Pleuronectes platessa - plaice: CPUE in numbers per 10,000 m2. See explanation of the plots.
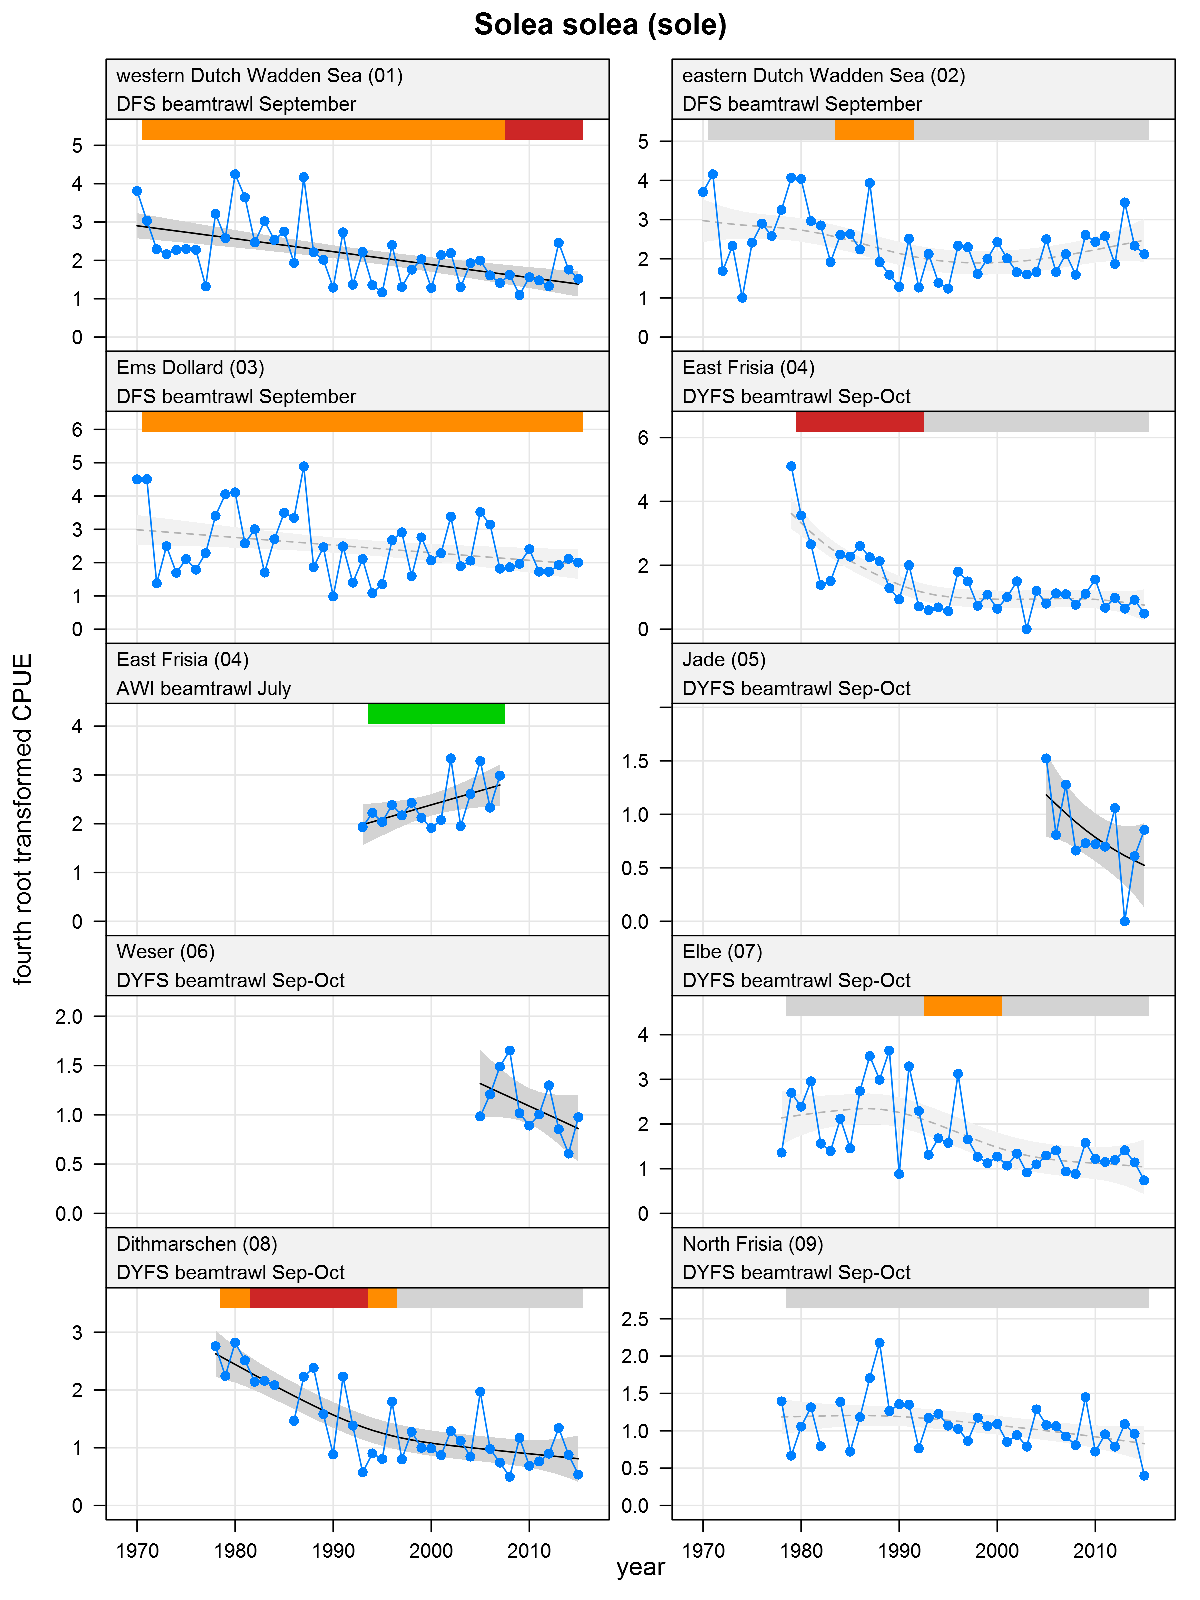
Solea solea - sole: CPUE in numbers per 10,000 m2. See explanation of the plots.
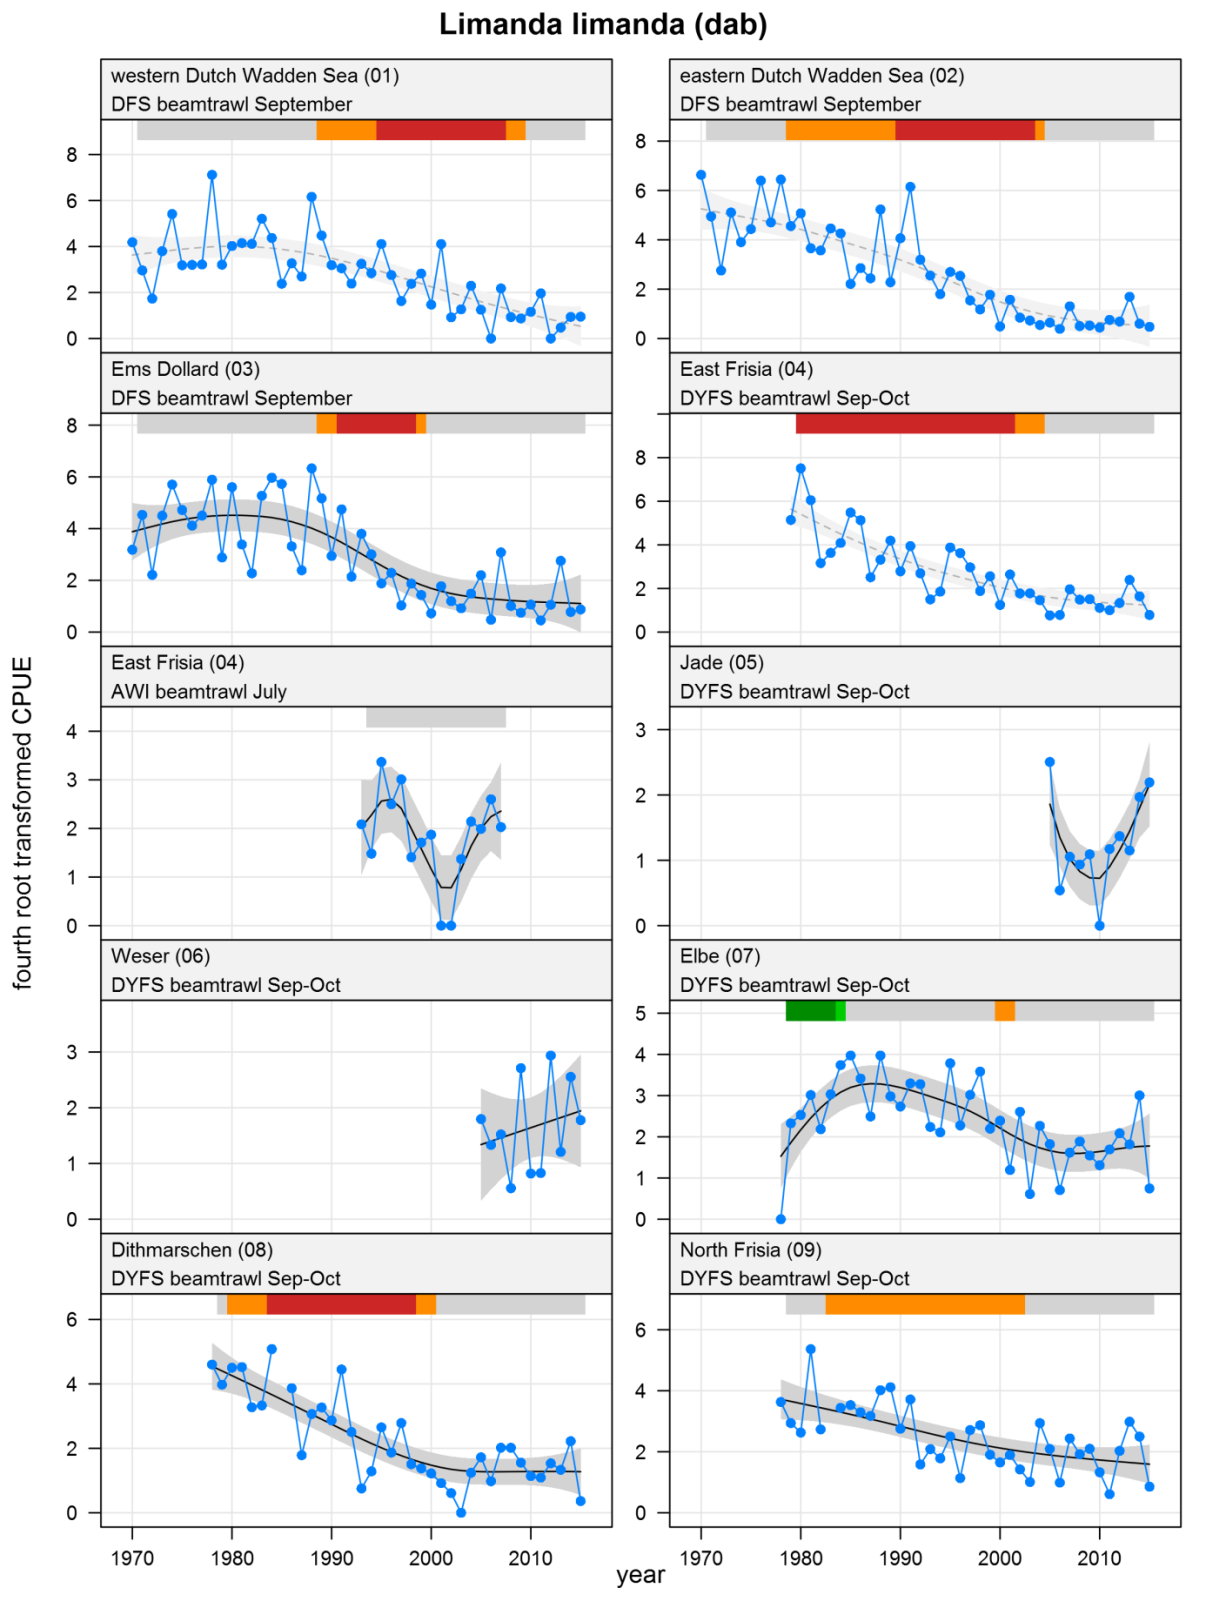
Limanda limanda - dab: CPUE in numbers per 10,000 m2. See explanation of the plots.
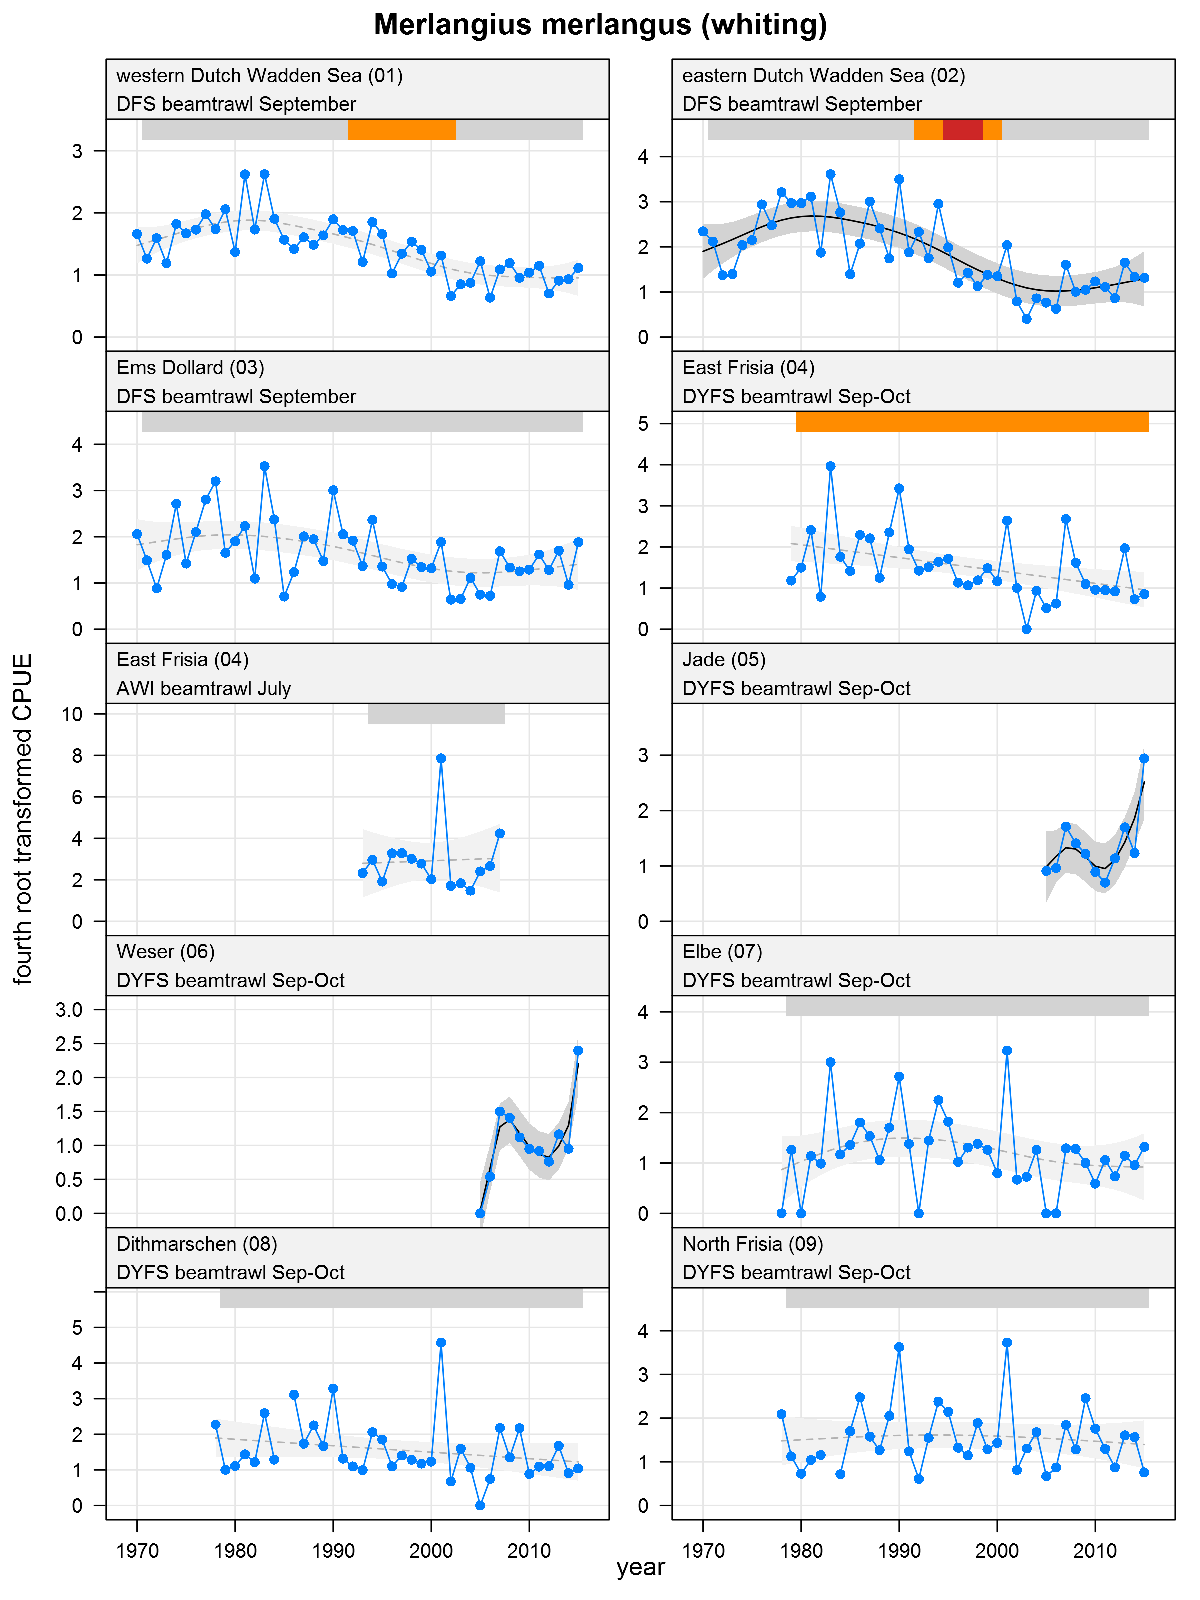
Merlangius merlangus - whiting: CPUE in numbers per 10,000 m2. See explanation of the plots.
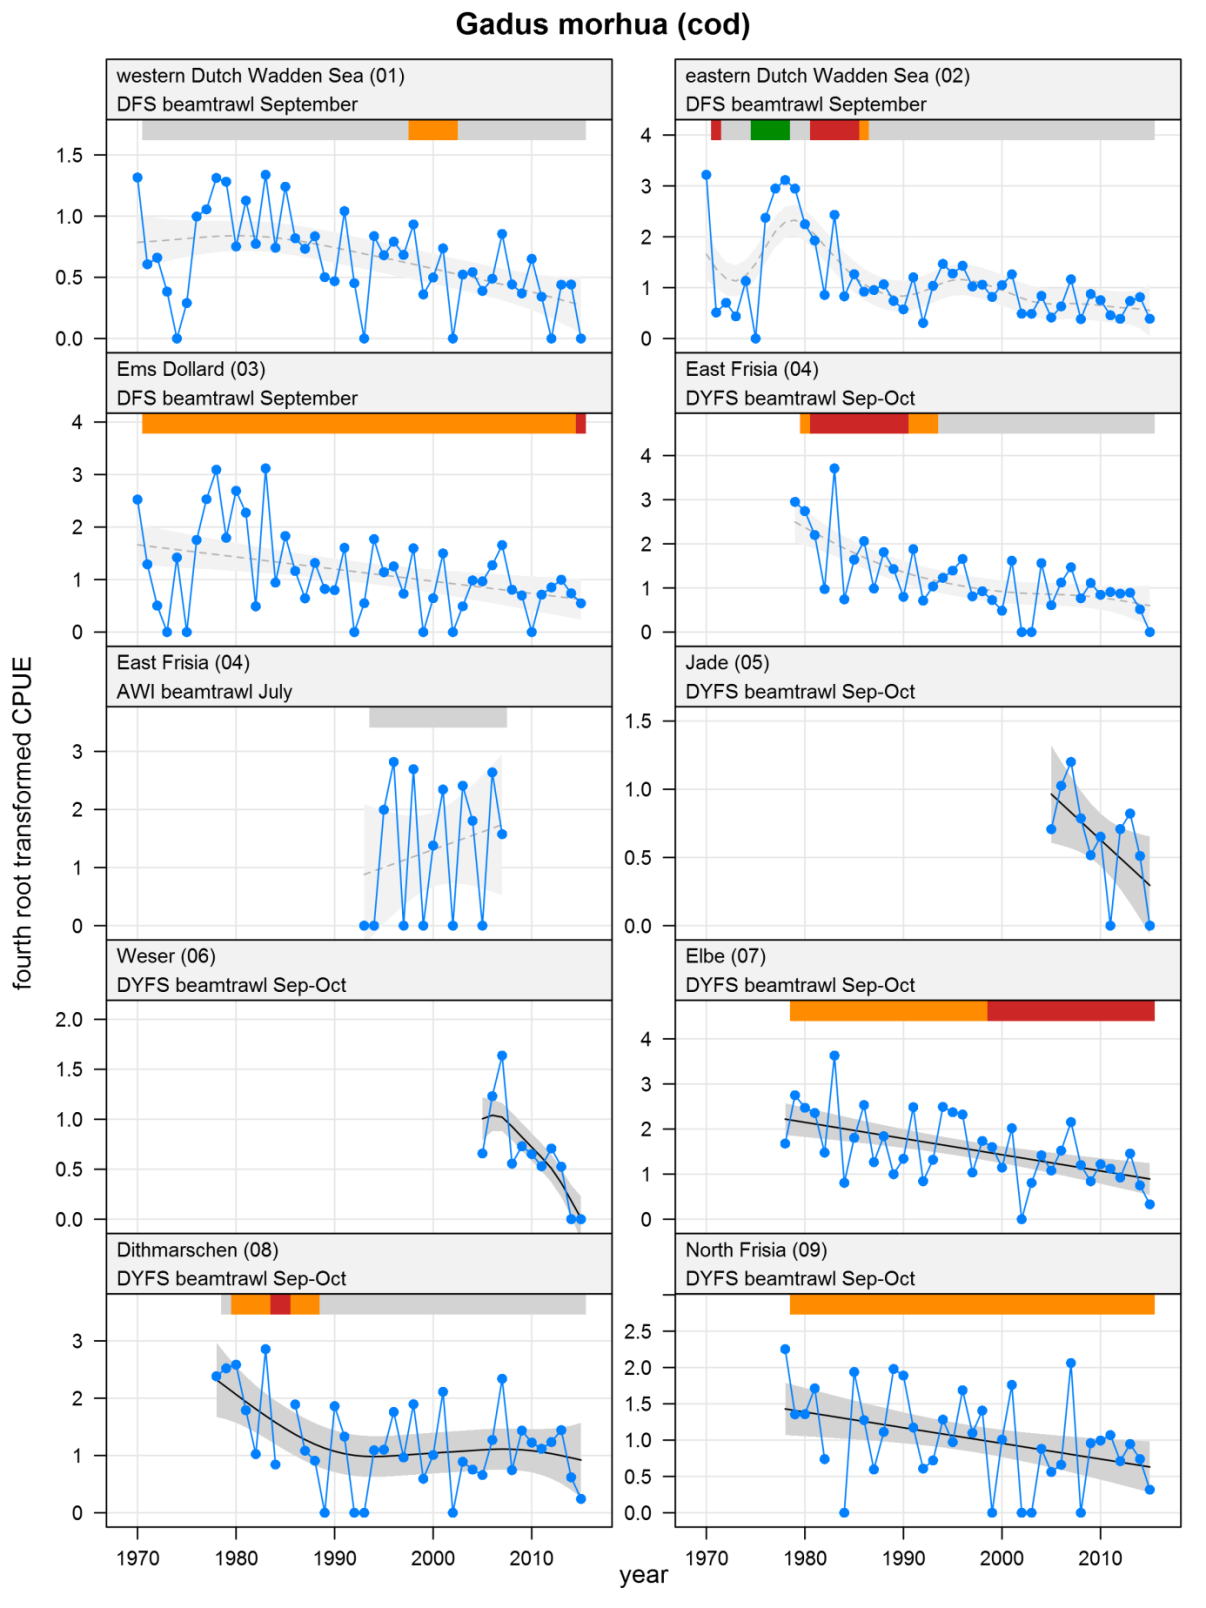
Gadus morhua - cod: CPUE in numbers per 10,000 m2. See explanation of the plots.
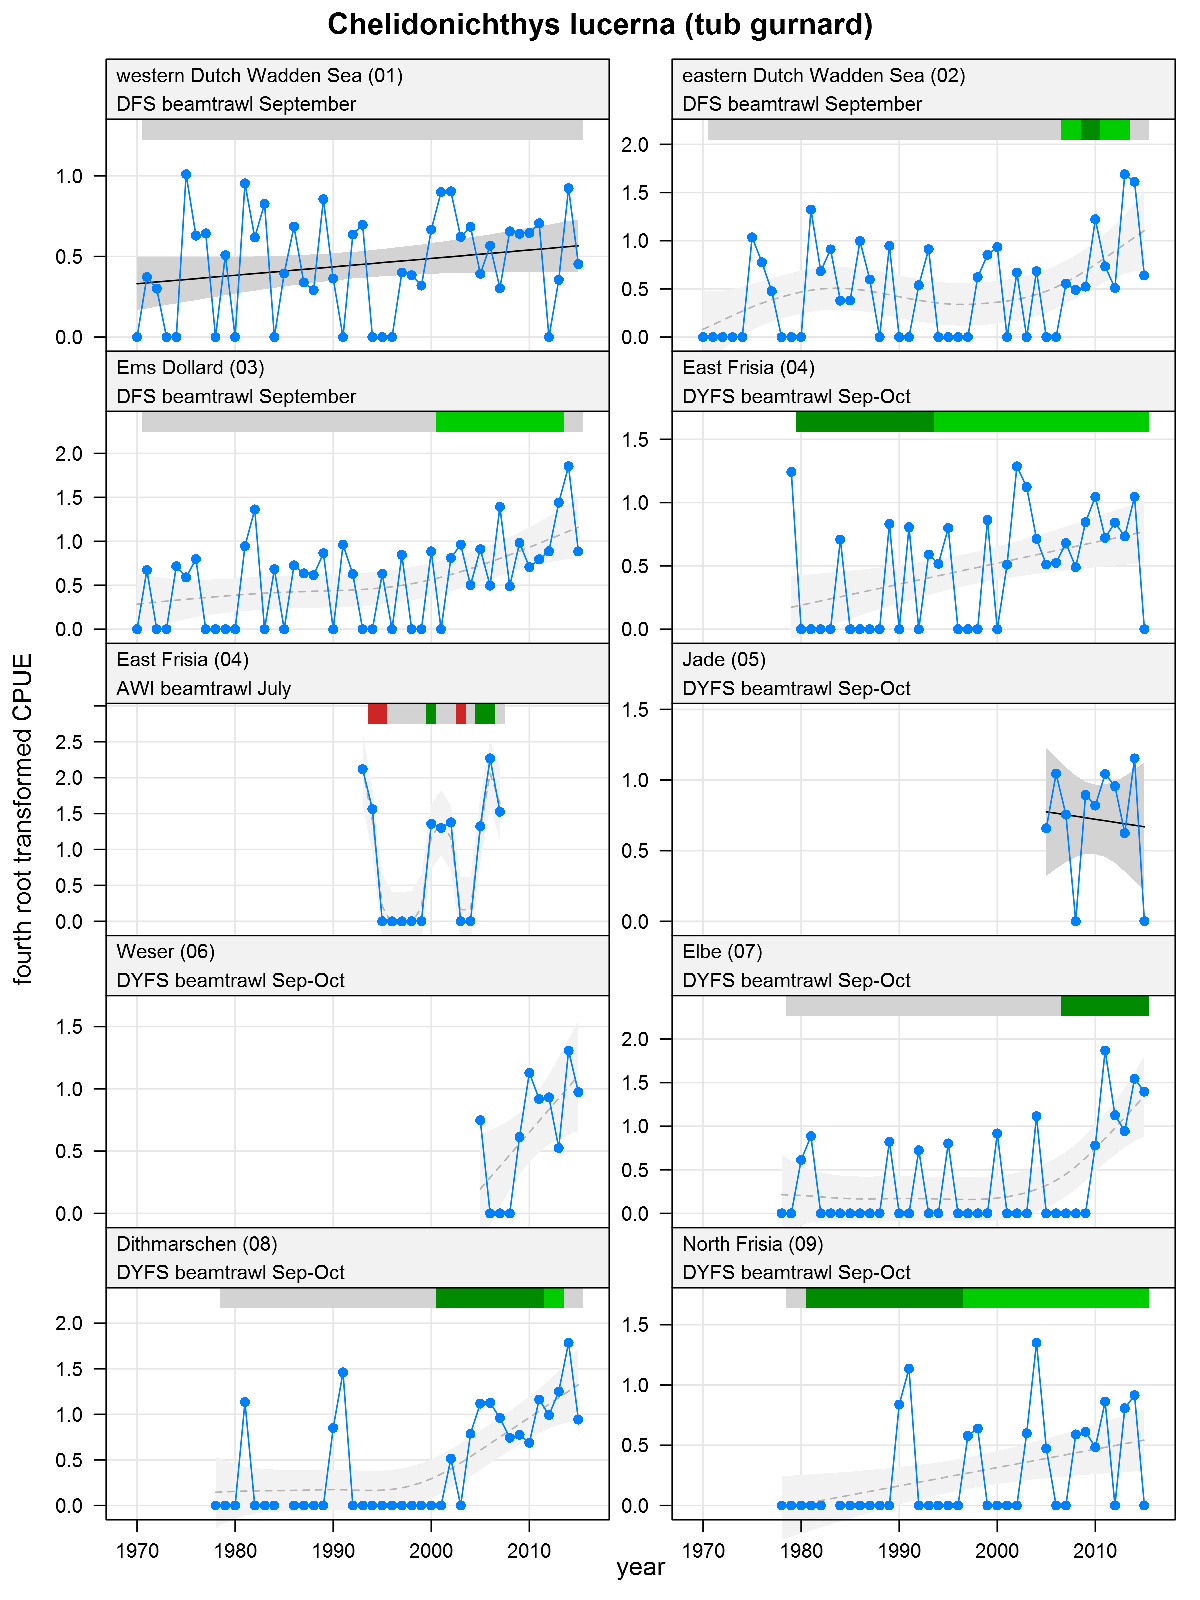
Chelidonichthys lucerna - tub gurnard: CPUE in numbers per 10,000 m2. See explanation of the plots.
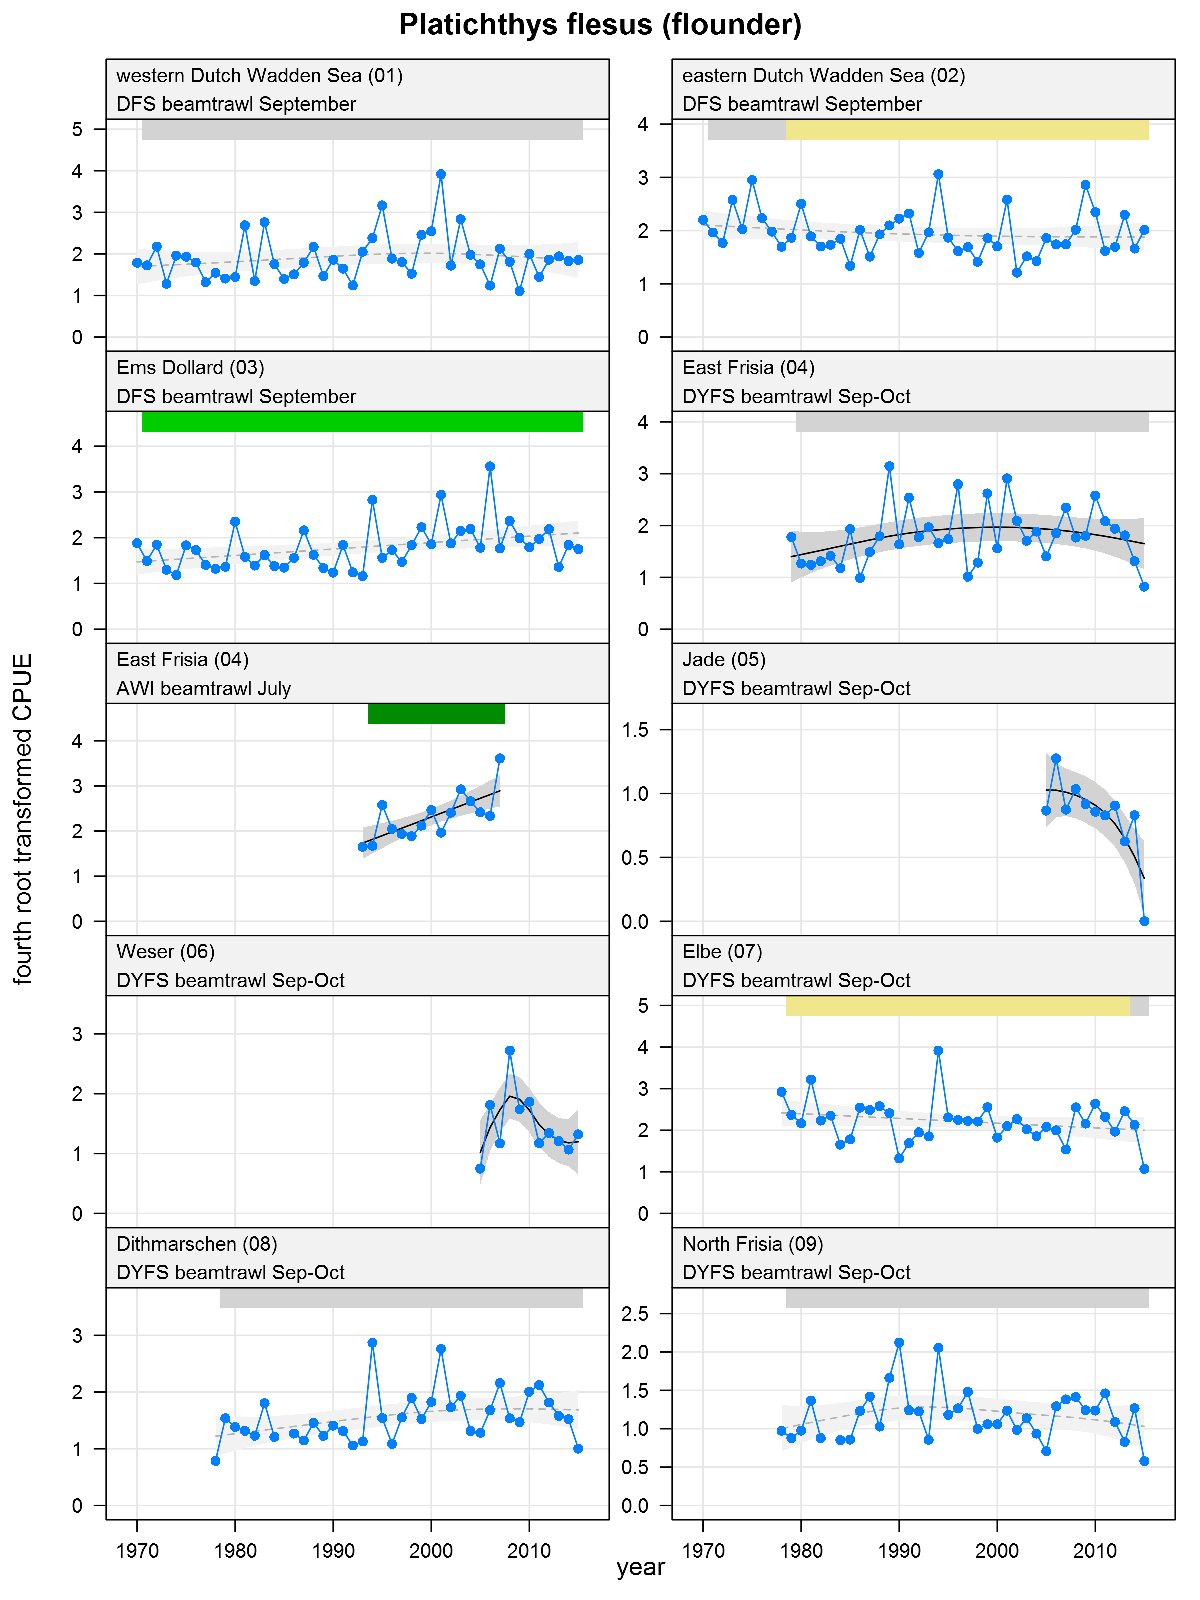
Platichthys flesus - flounder: CPUE in numbers per 10,000 m2. See explanation of the plots.
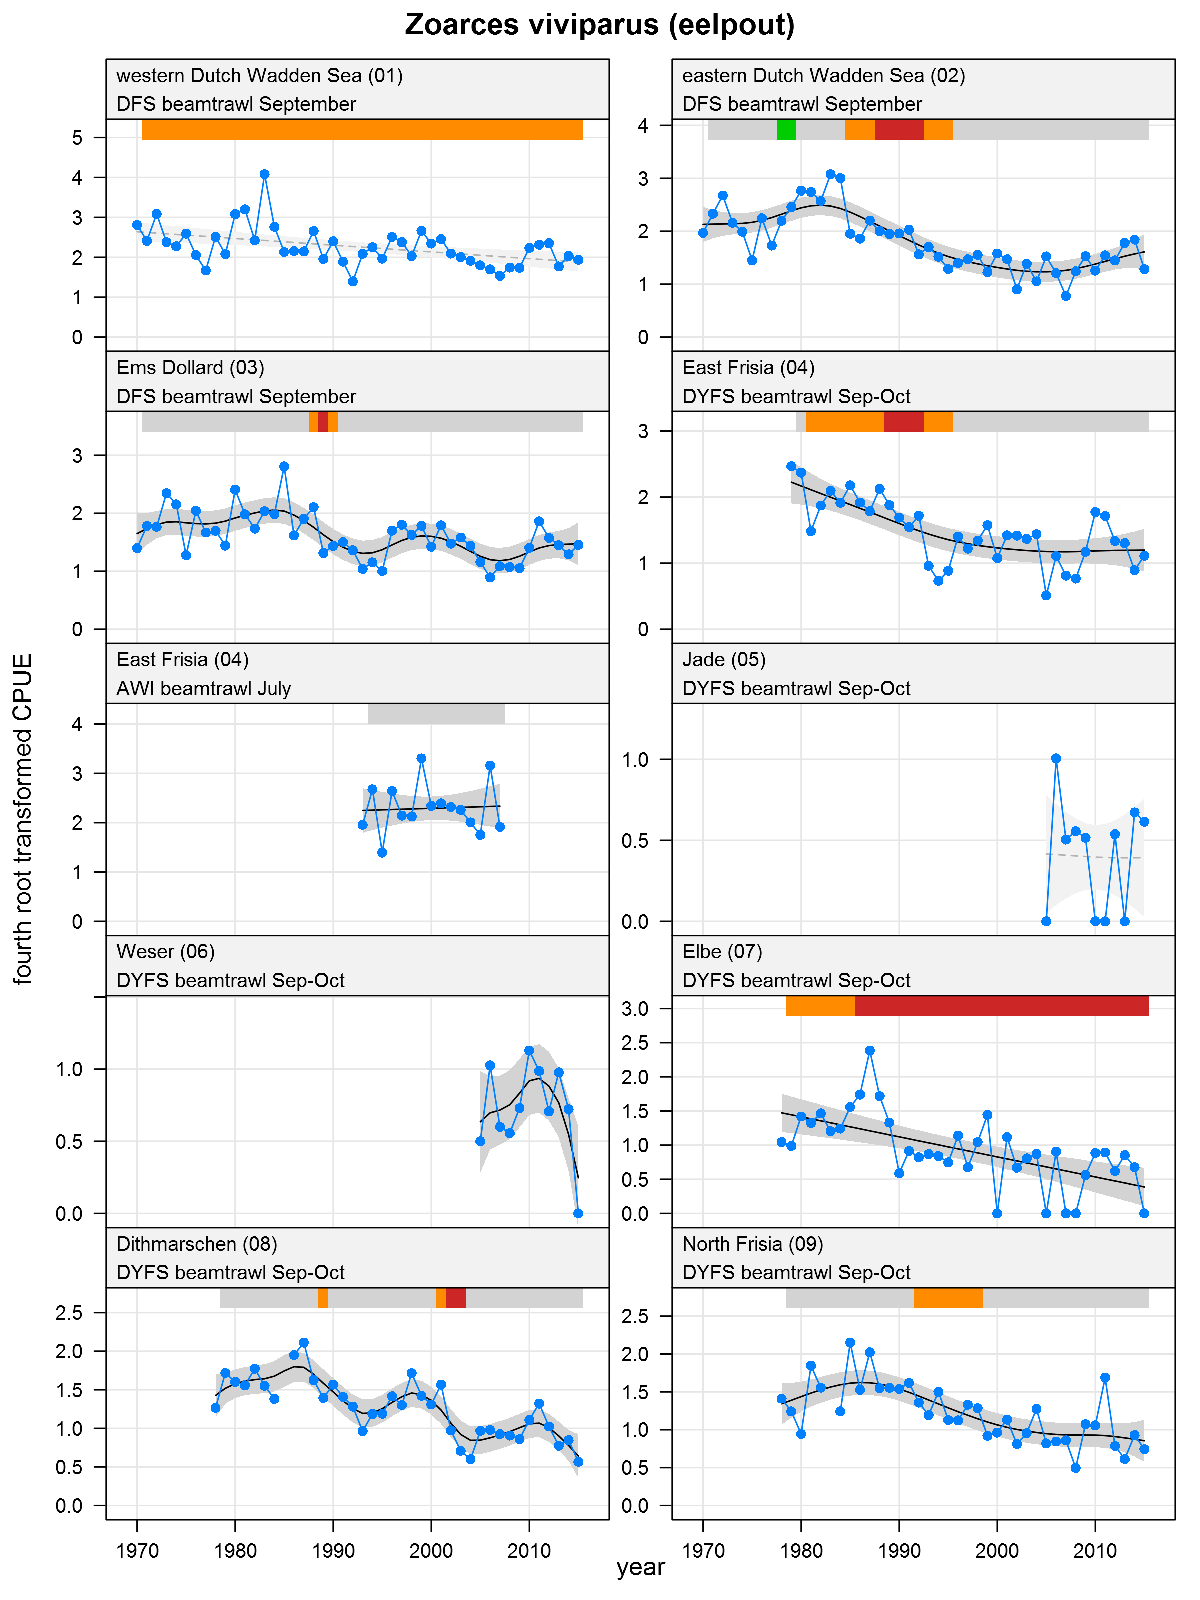
Zoarces viviparus - eelpout: CPUE in numbers per 10,000 m2. See explanation of the plots.

Myoxocephalus scorpius - bullrout: CPUE in numbers per 10,000 m2. See explanation of the plots.

Ciliata mustela - five bearded rockling: CPUE in numbers per 10,000 m2. See explanation of the plots.
Agonus cataphractus - hooknose: CPUE in numbers per 10,000 m2. See explanation of the plots.
Syngnathus sp. - pipefishes: CPUE in numbers per 10,000 m2. See explanation of the plots.
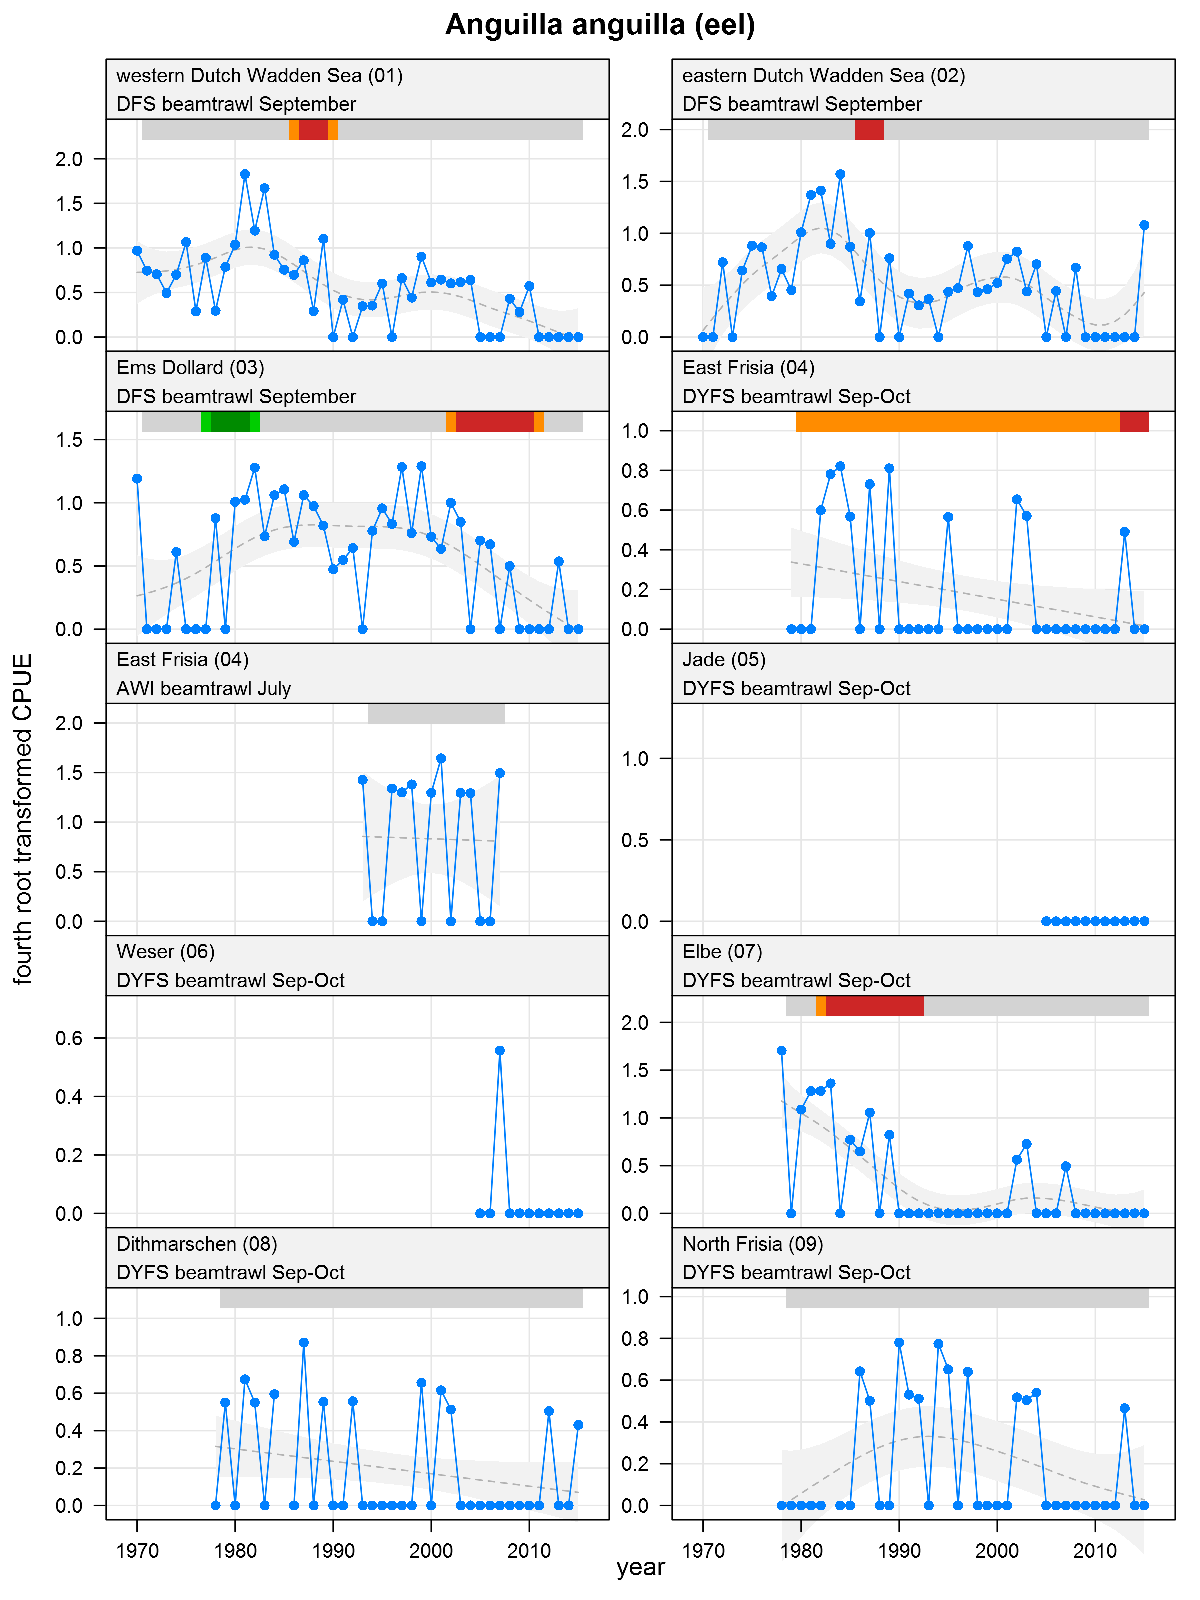
Anguilla anguilla - eel: CPUE in numbers per 10,000 m2. See explanation of the plots.
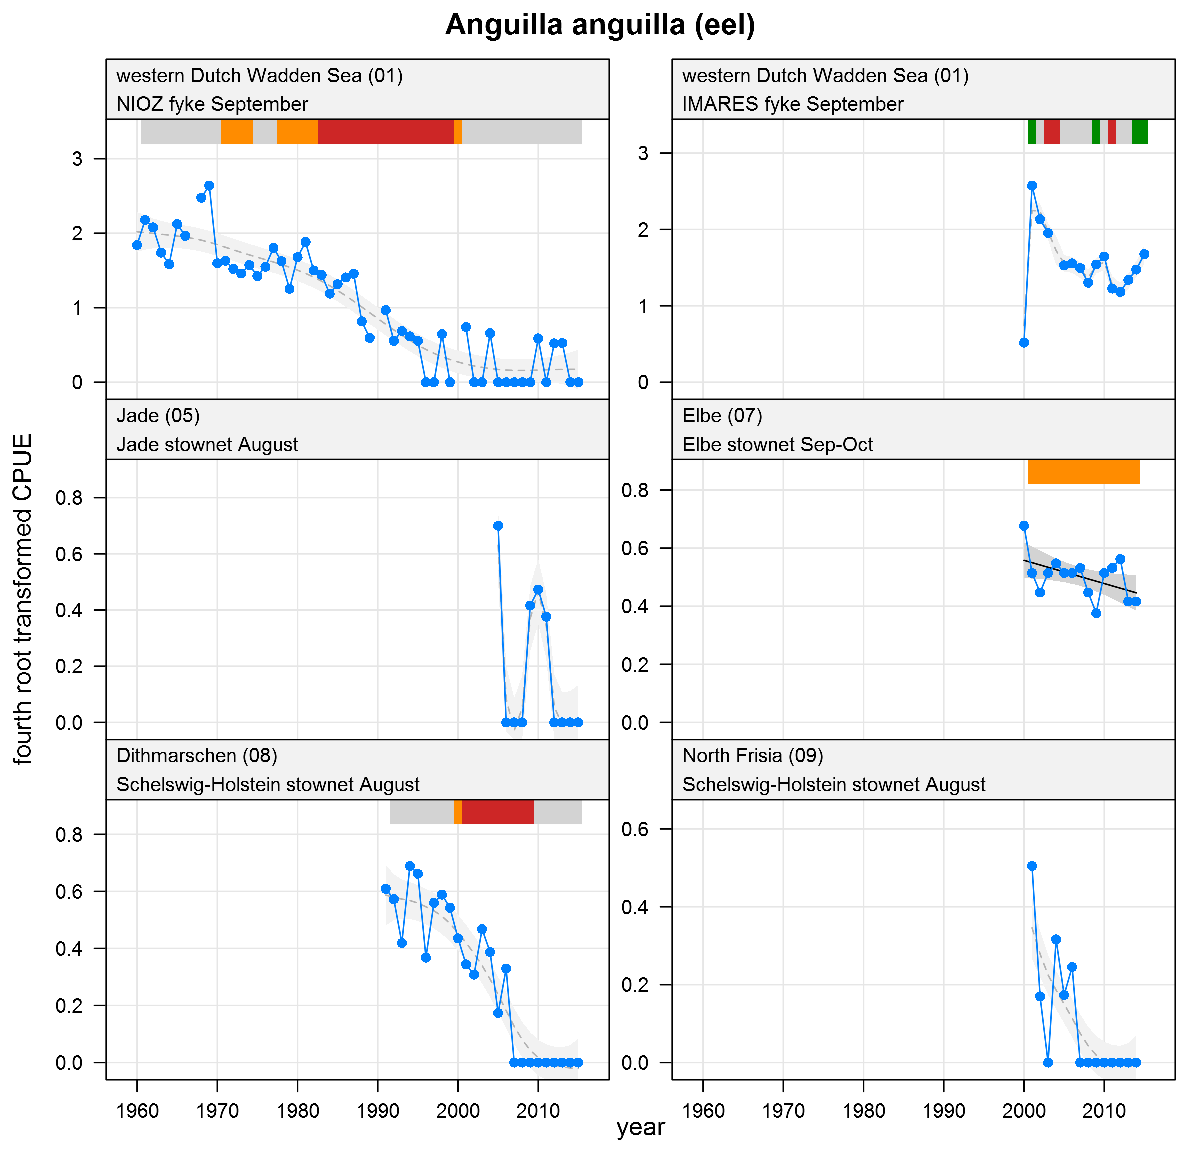
Anguilla anguilla - eel: CPUE in numbers per fyke day (fykes) or numbers per 10,000 m3(stow nets). See explanation of the plots.
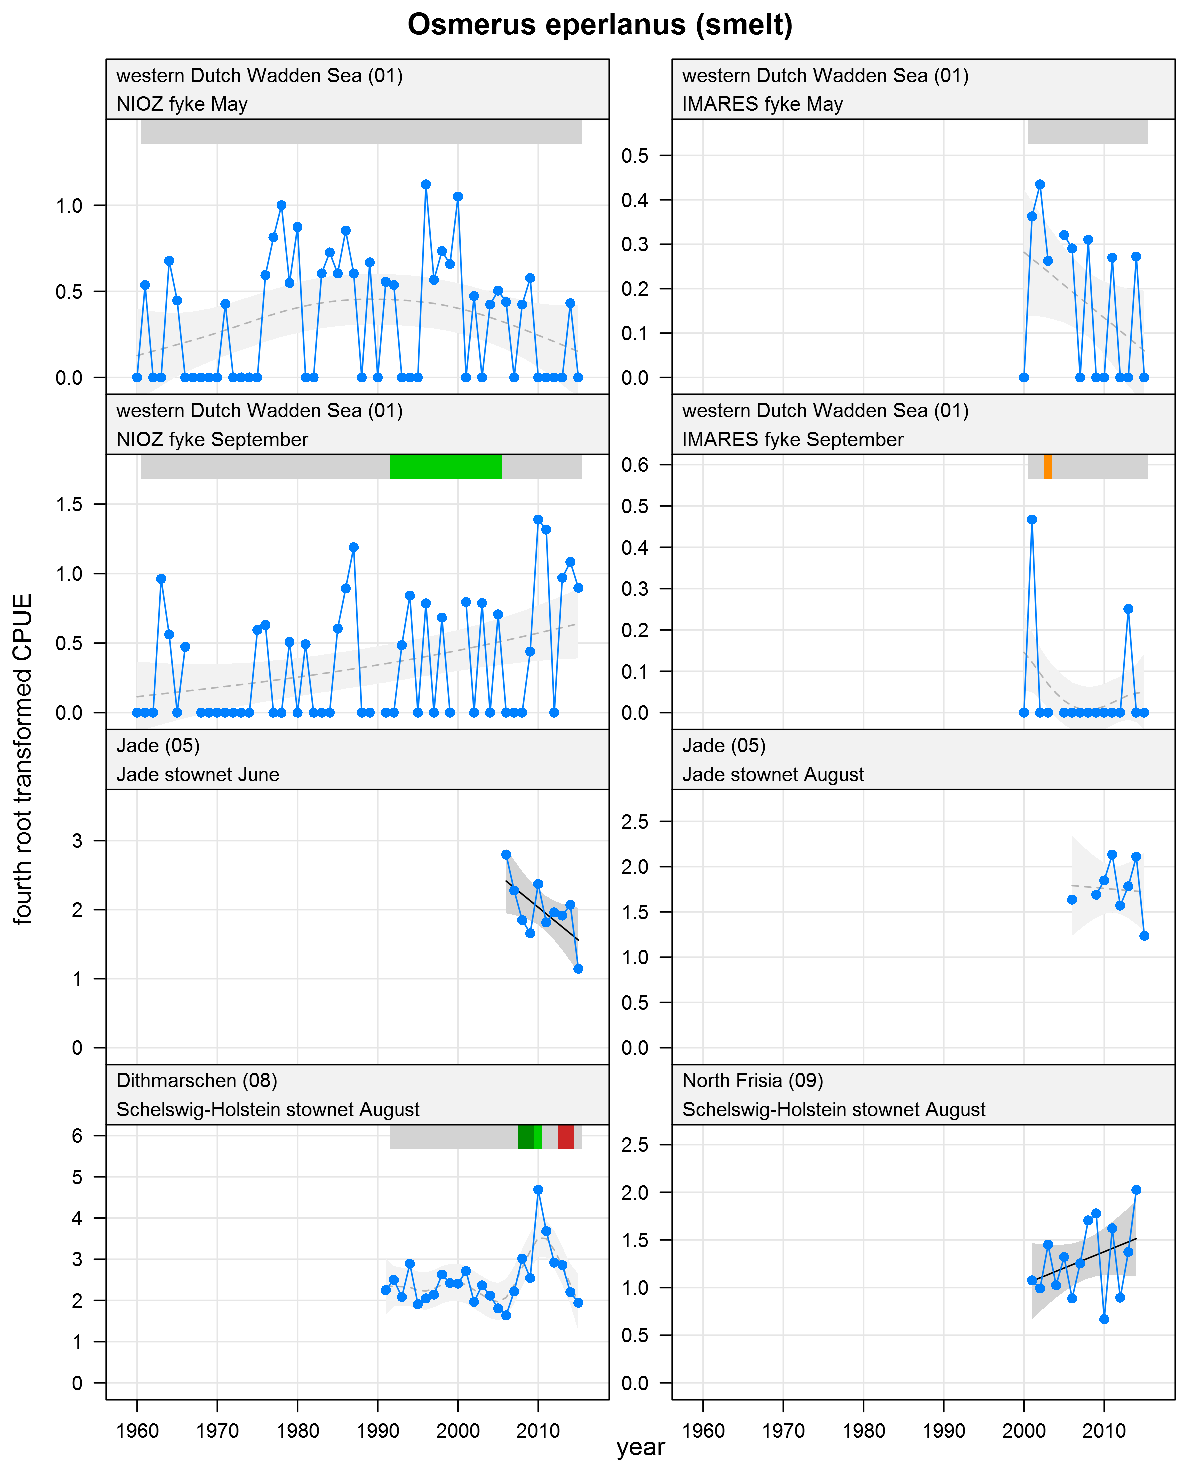
Osmerus eperlanus - smelt: CPUE in numbers per fyke day (fykes) or numbers per 10,000 m3 (stow nets). See explanation of the plots. May-June catches represent adults, August-September catches represent juveniles.
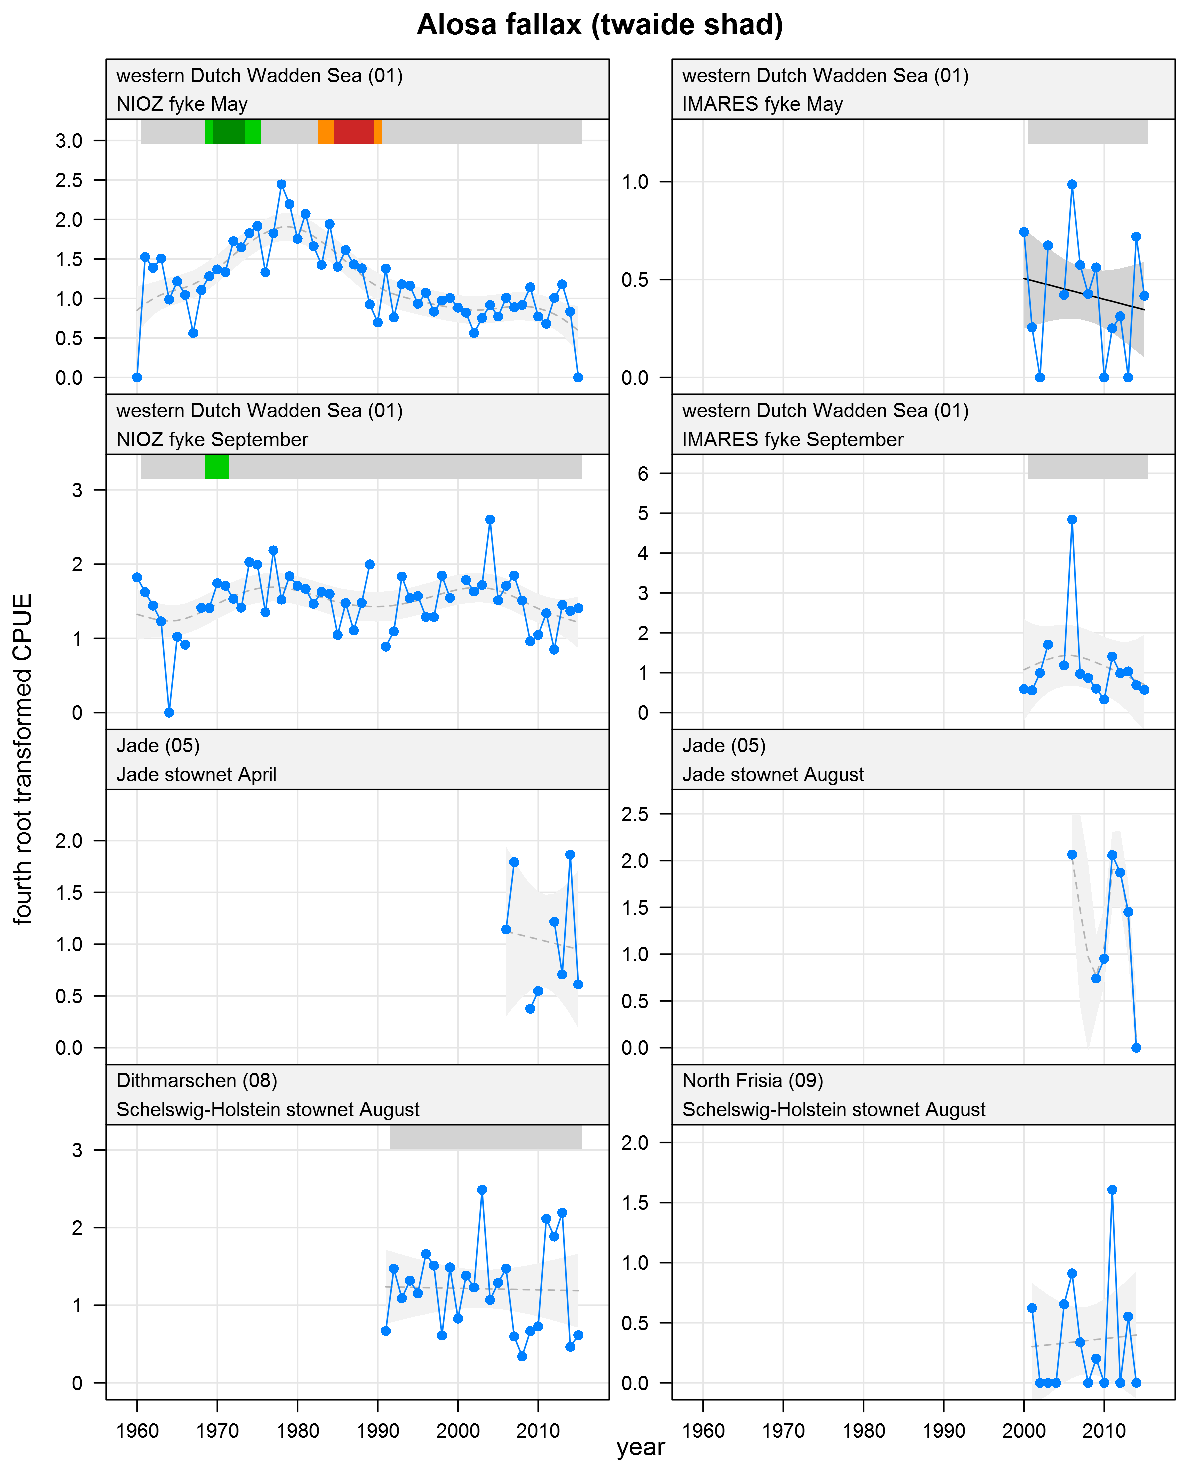
Alosa fallax - twaite shad: CPUE in numbers per fyke day (fykes) or numbers per 10,000 m3 (stow nets). See explanation of the plots. April-May catches represent adults, August-September catches represent juveniles.
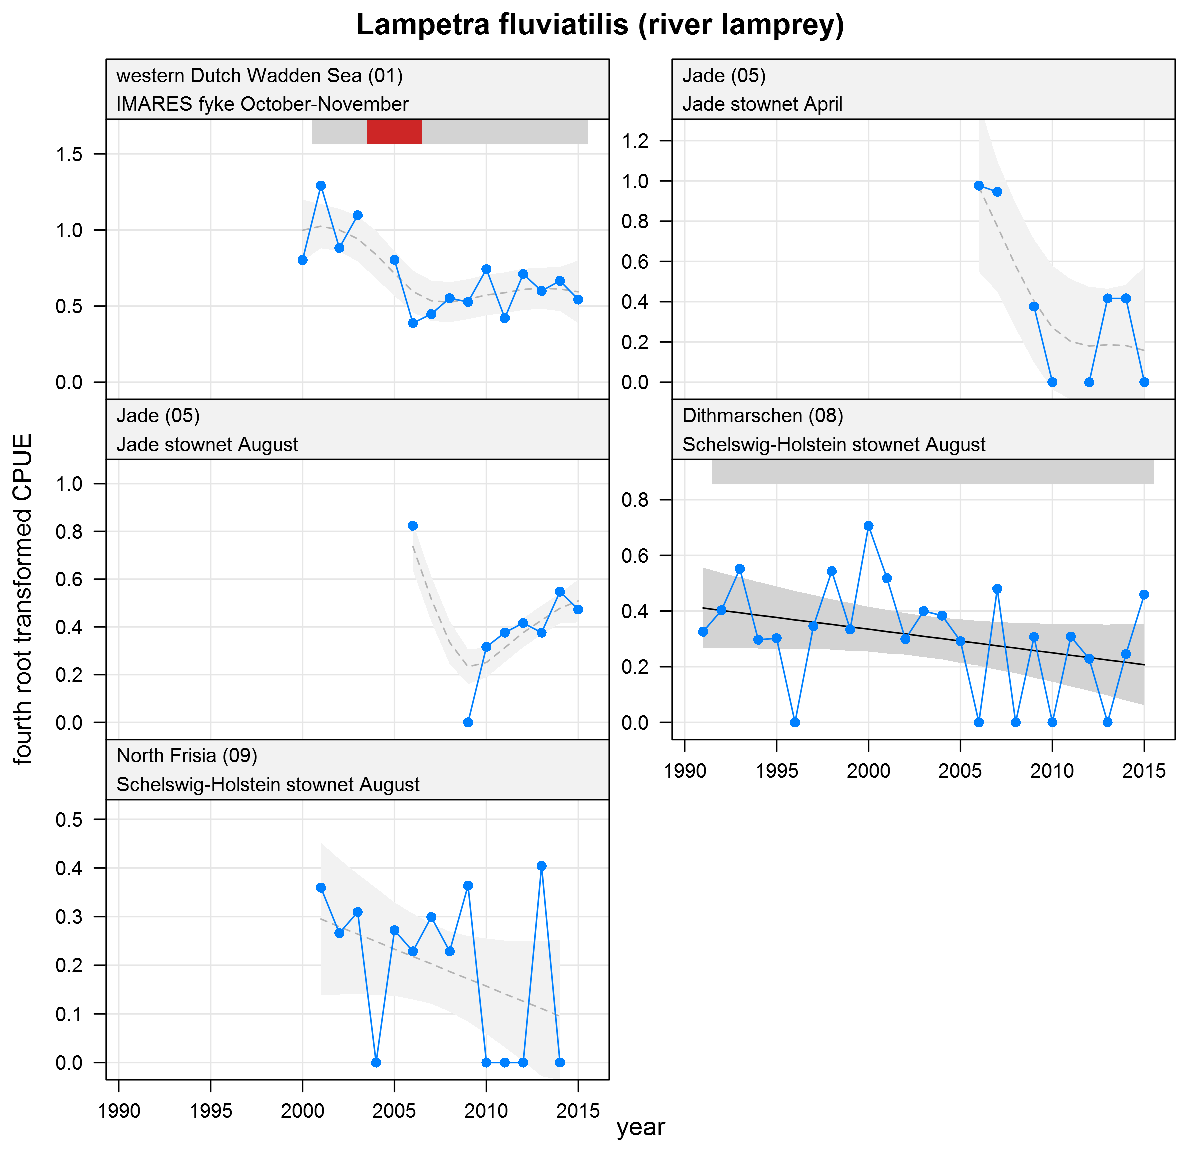
Lampetra fluviatilis - river lamprey: CPUE in numbers per fyke day (fykes) or numbers per 10,000 m3 (stow nets). See explanation of the plots.
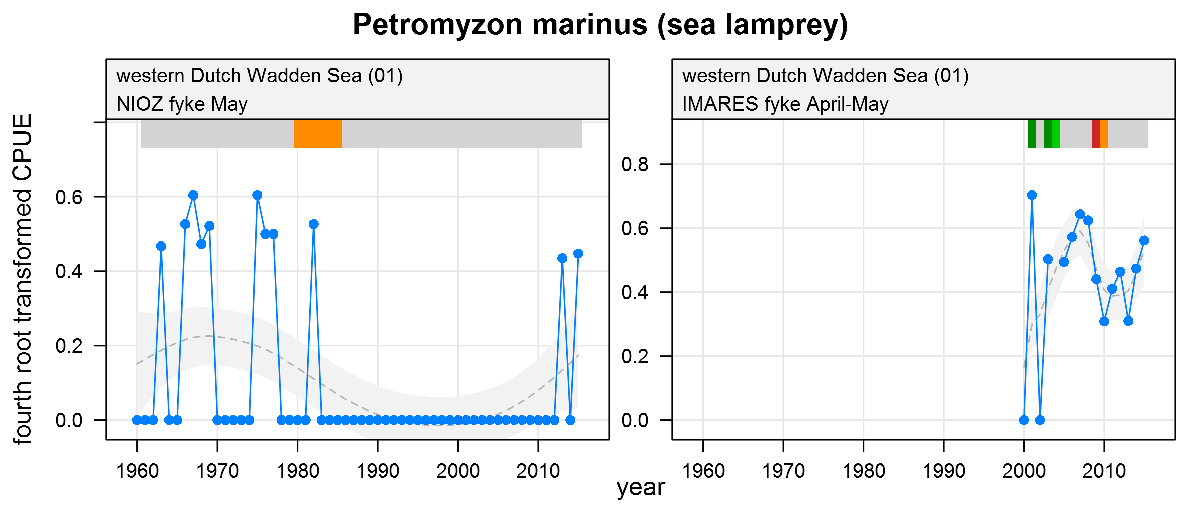
Petromyzon marinus - sea lamprey: CPUE in numbers per fyke day. See explanation of the plots.
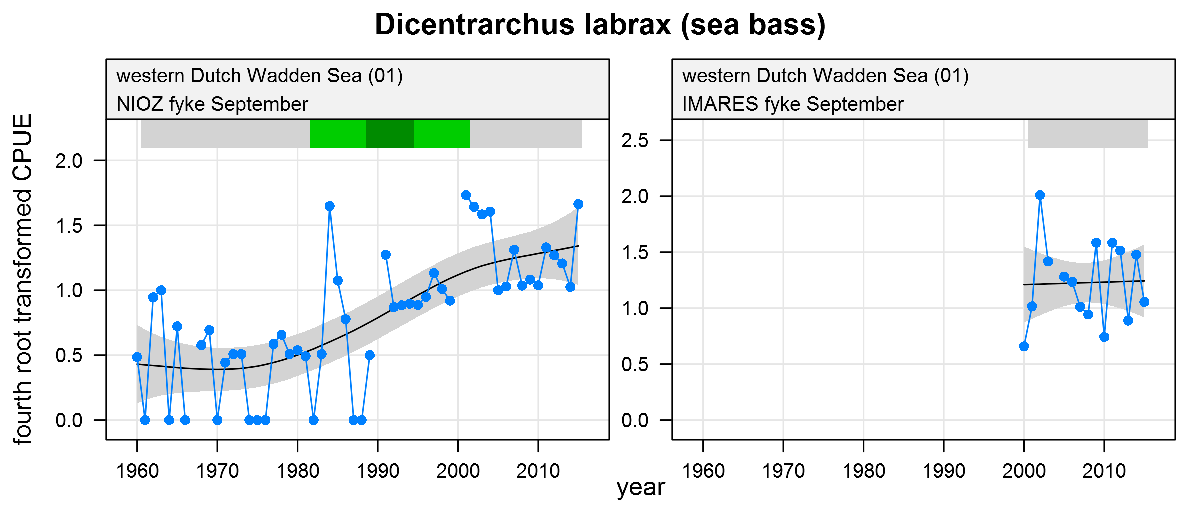
Dicentrarchus labrax - sea bass: CPUE in numbers per fyke day. See explanation of the plots.

Clupea harengus - herring: CPUE in numbers per fyke day (fykes) or numbers per 10,000 m3 (stow nets). See explanation of the plots.
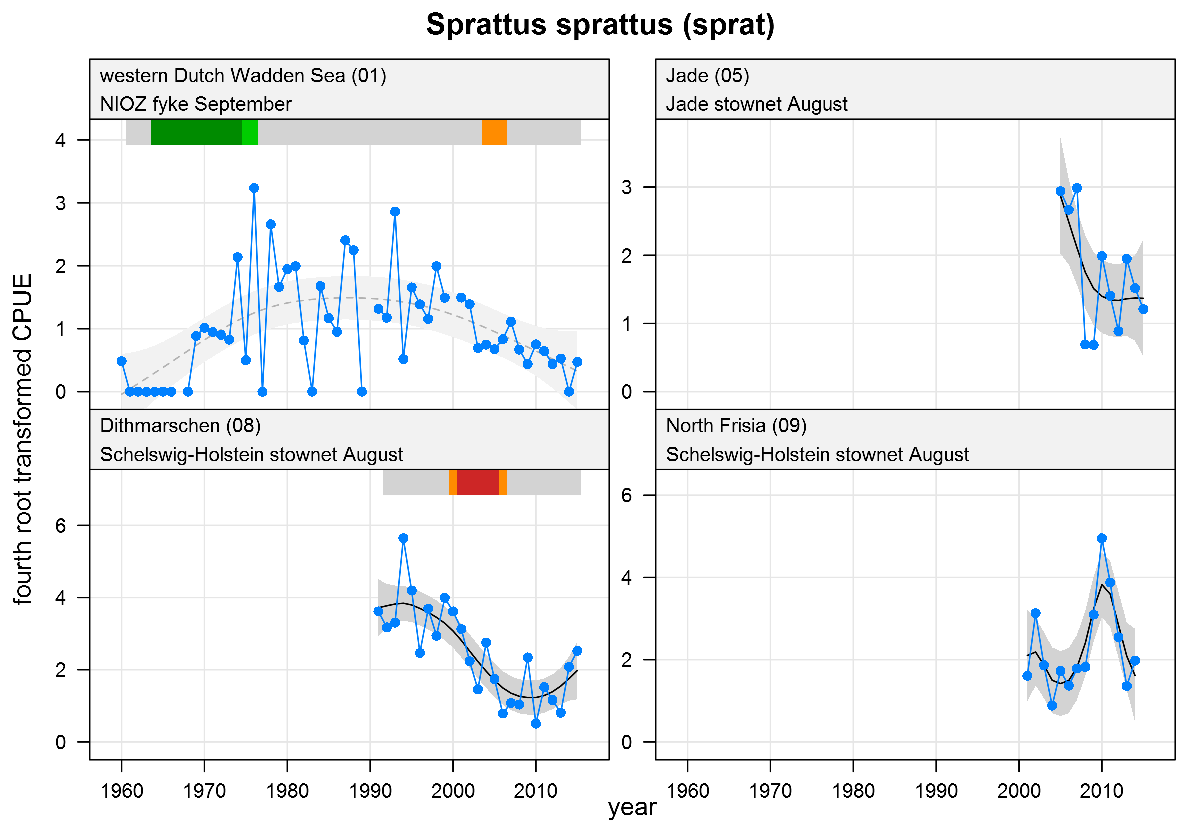
Sprattus sprattus - sprat: CPUE in numbers per fyke day (fykes) or numbers per 10,000 m3 (stow nets). See explanation of the plots.
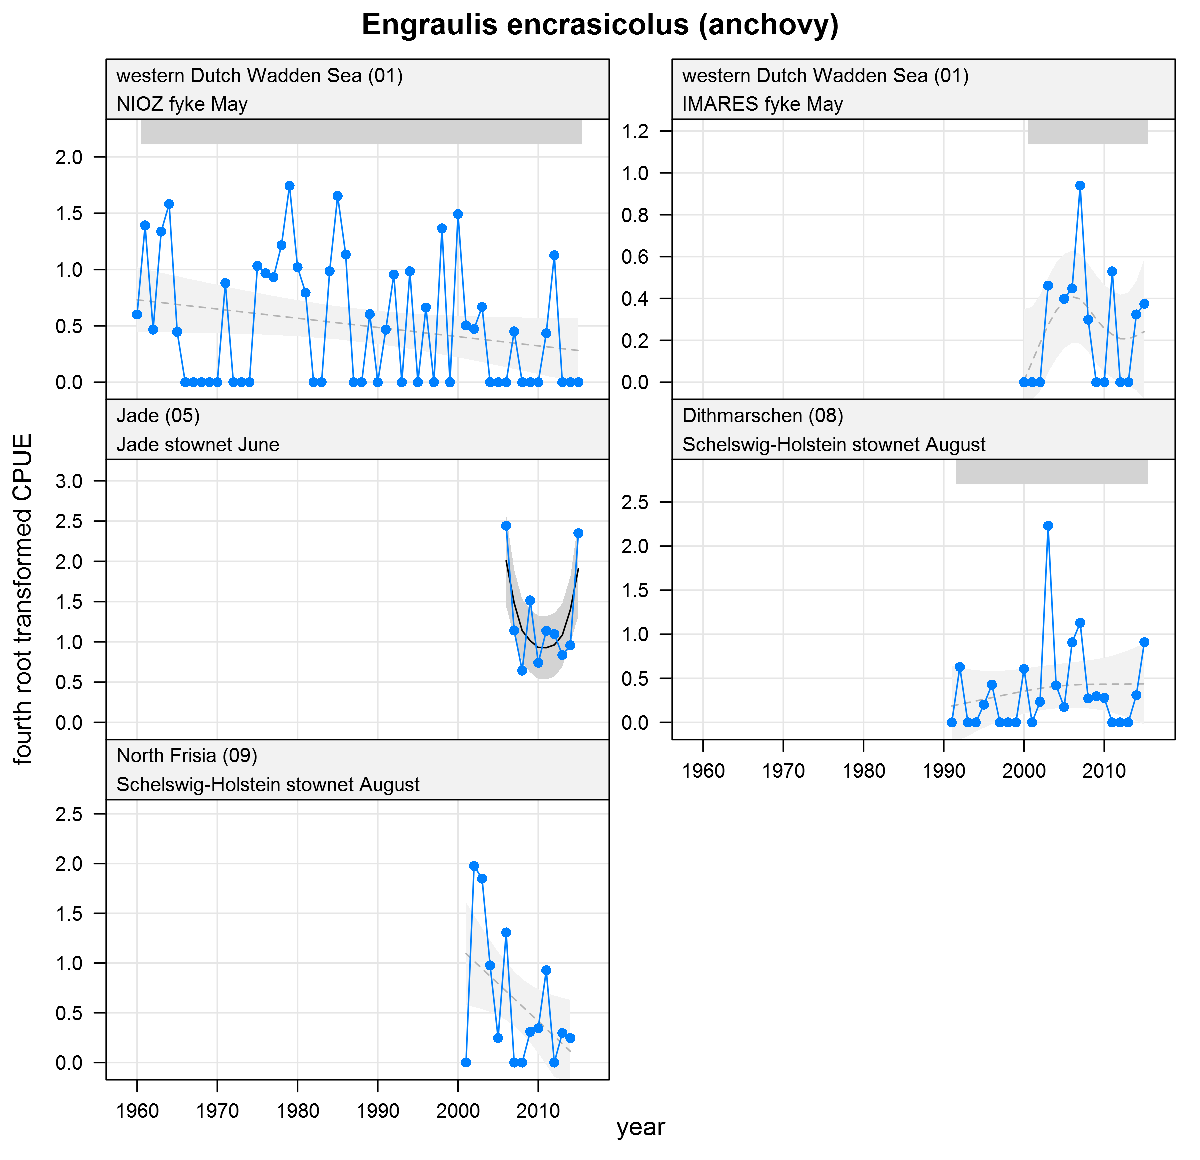
Engraulis encrasicolus - anchovy: CPUE in numbers per fyke day (fykes) or numbers per 10,000 m3 (stow nets). See explanation of the plots.

Sardina pilchardus - pilchard: CPUE in numbers per fyke day. See explanation of the plots.

Osmerus eperlanus - smelt: Mean abundance (± s.e.) of (sub)adults (left) and juveniles (right) in Elbe (a-b), Eider (c-d), Weser (e-f) and Ems (g-h) estuaries. Curve: moving average (2 years).
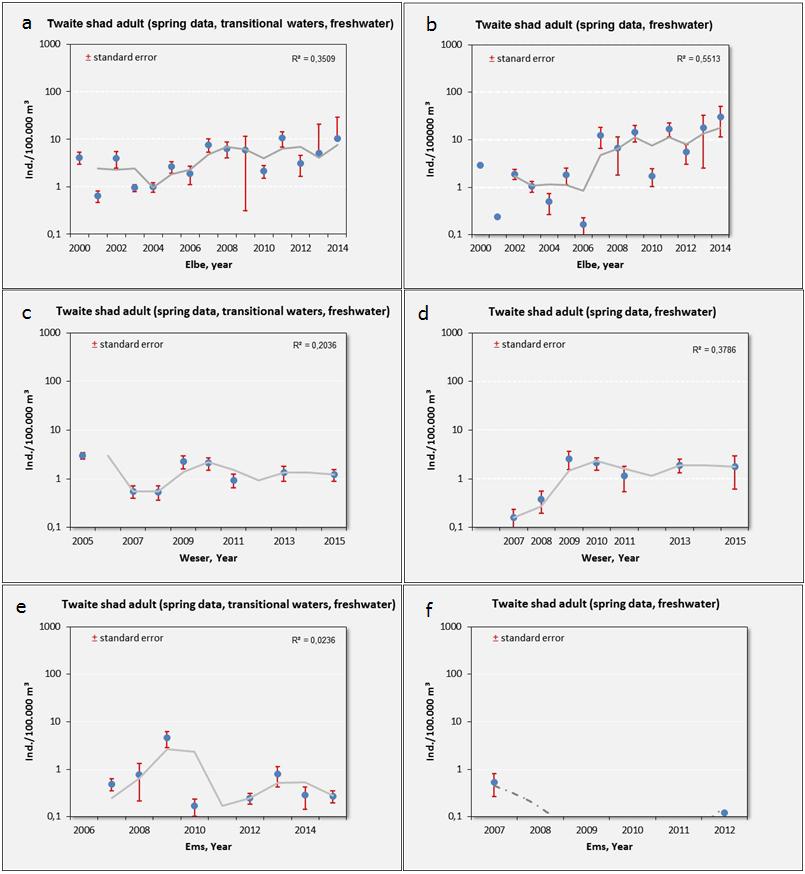
Alosa fallax - twaite shad: Mean abundance (± s.e.) of adults in the whole estuary (left) and on the main spawning ground in the lower freshwater and upper oligohaline section of the estuary (right), for the Elbe (a-b), Weser (c-d) and Ems (e-f) estuaries. Curve: moving average (two years).
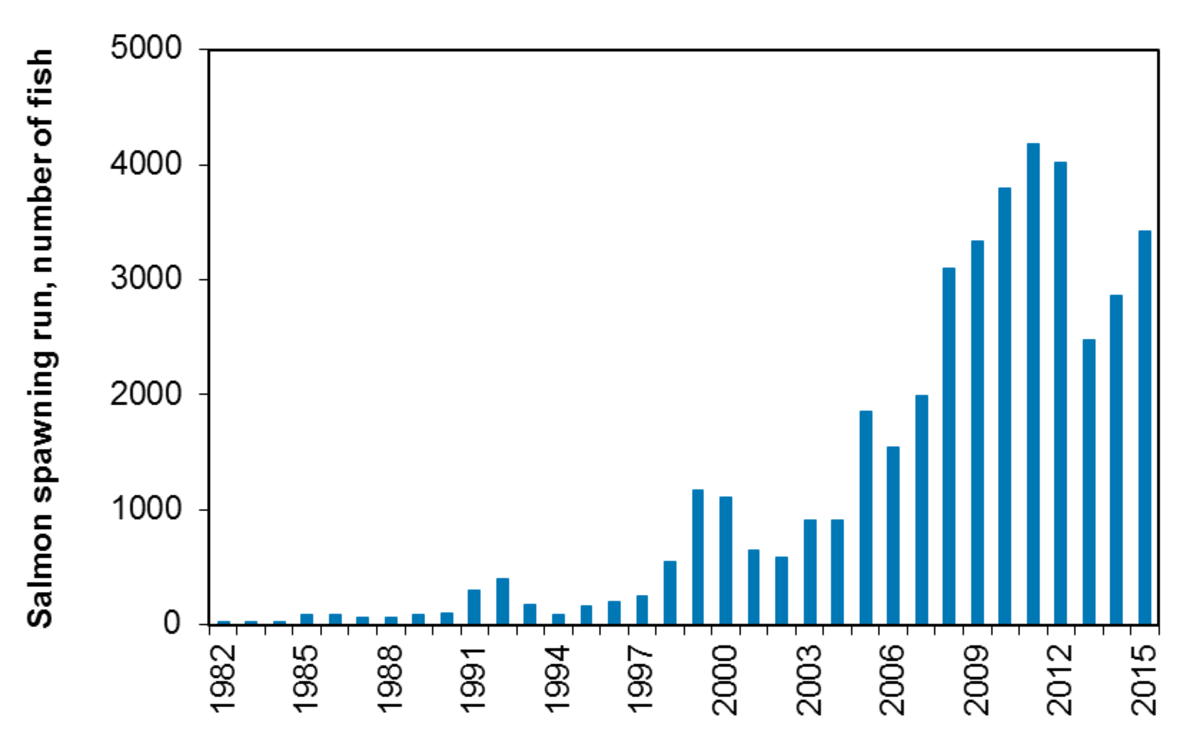
Salmo salar - salmon: The development of salmon fishing in river Skjern has been closely investigated and is shown as an example. The trends in the three main Wadden Sea rivers are similar.

Coregonus oxyrinchus - North Sea houting: The estimated annual spawning run of North Sea houting in Ribe å, estimated based on mark-recapture surveys.
Salt marsh creeks off Ehstensiel (Eider estuary, Schleswig-Holstein Wadden Sea): Species list and relative abundance of fish caught with fyke nets. Sample size is given in the last row.
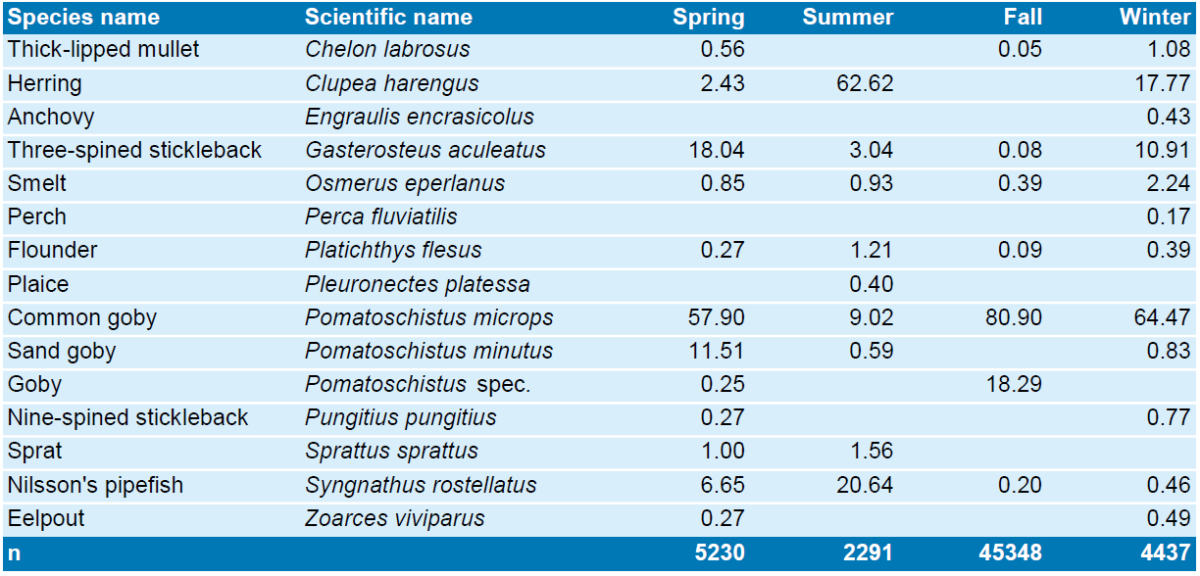
Salt marsh creeks in Dieksanderkoog Nord (Dithmarschen, Schleswig-Holstein Wadden Sea): Species list and relative abundance of fish caught with fyke nets. Sample size is given in the last row. Data courtesy of Dea Deutsche Erdöl AG.

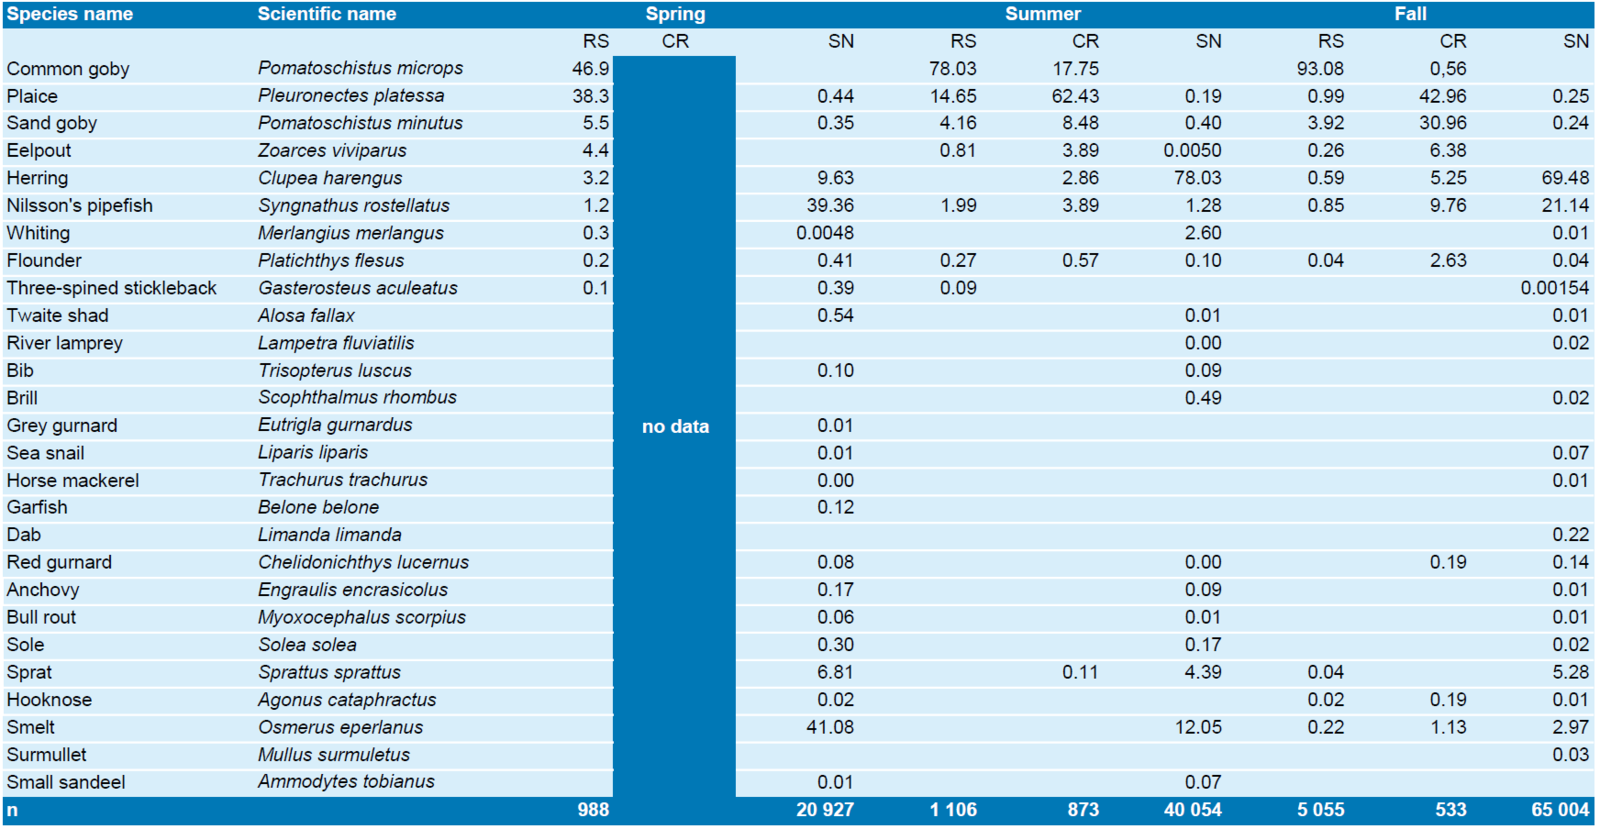
Pacific oyster reef at Kaiserbalje (Jade, Lower Saxon Wadden Sea): Species list and relative abundance of fish caught with fyke nets. For reference to the catches on the reef surface (RS) and in intertidal creeks surrounding the reef (CR; no data in spring), results of ship-based stow net catches (SN) collected in parallel to the data collection on the reef are presented. Sample size is given in the last row. Stow net data courtesy of National Park administration Lower Saxony Wadden Sea.
Annex 4. Evaluation recommendations QSR 2009
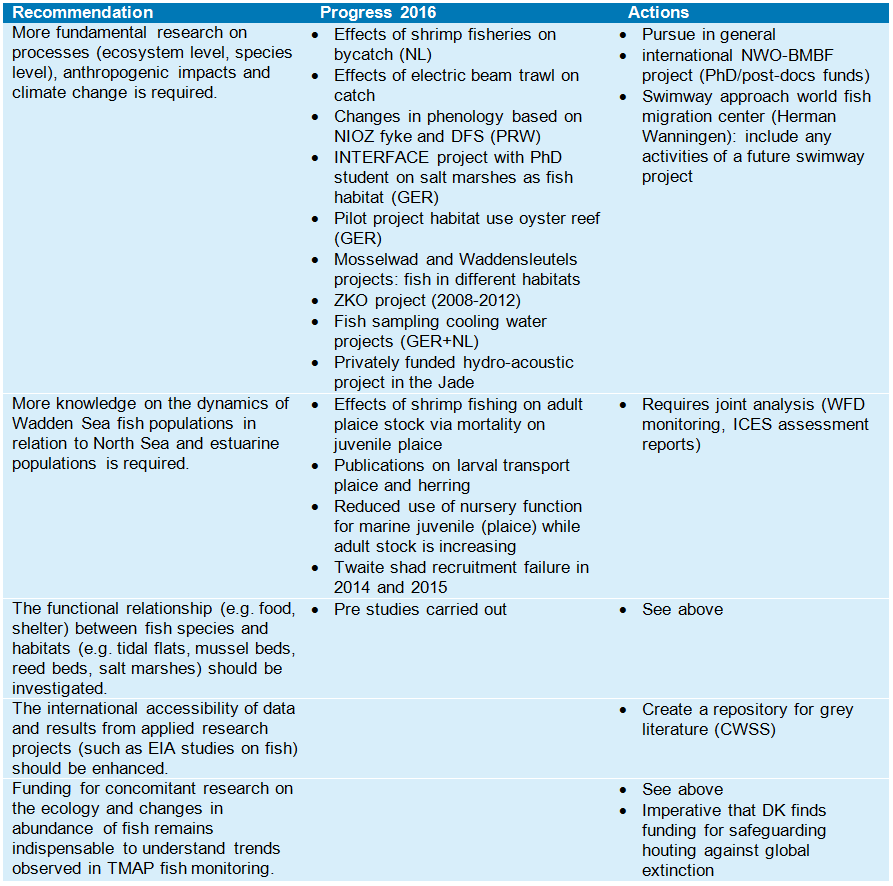
The recommendations formulated in the fish chapter of the 2009 QSR report were evaluated in order to describe progress on the issues addressed.
Monitoring

Research
Management
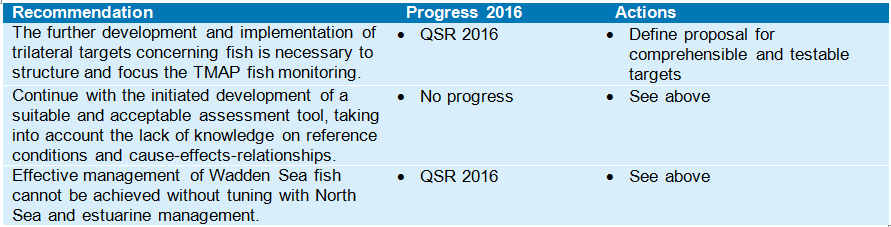
Trilateral policy
