Annex "Macrozoobenthos"
Annex 1
Methods
In all three Wadden Sea countries long-term macrozoobenthos monitoring series are maintained (Figure 1, Table Annex 1) by several organizations. In all monitoring areas the benthos is sampled at individual sampling stations or at stations along transects. Positions are fixed and mostly visited twice a year, first in late winter or spring and again in summer or autumn. At each sampling station a sediment sample with a quantified surface area is taken and washed over a 1 mm2 sieve. All material retained is brought to the lab and directly processed or first preserved and then processed. Animals are sorted from the material retained from the sieve, identified to the lowest possible taxonomic level and counted. To measure biomass animals are dried in a drying oven, weighed, ashed and reweighed. In bivalves and large gastropods the shell is removed before drying. Subtracting the ash weight from dry weight gives the ash free dry weight. Missing biomass values were substituted by the measured density times average individual mass. The local average individual mass was estimated with a linear biomass density relationship after removing extreme high biomass values that were more than 2.5 standard deviations above the relationship. These outlying values were also replaced in the data set by average individual biomass times density.
The nomenclature of the different series was synchronized (January 2017) with the World Register of Marine Species (WoRMS) database at www.marinespecies.org. Notable recent scientific name changes were Macoma balthica, the Baltic tellin, into Limecola balthica and Ensis directus, the invasive Atlantic razor clam, into Ensis leei. Several species with inconsistent determination among monitoring areas were lumped into higher taxonomic ordering. Species were categorized as native or invasive according to Buschbaum et al. (2012).
Arithmetic means were calculated for biomass and density data. Total Wadden Sea averages and averages for two sub regions Northeastern (NE) and Southwestern (SW) Wadden Sea were calculated with a subset of the monitoring areas. Selection of areas was based on the length of the series (at least 25 years) and the local environment, excluding Lütetsburger Plate (shorter series dominated by epibenthic bivalve bed), Dollard (estuarine) and the subtidal of the western Dutch Wadden Sea. Species were ranked based on biomass contribution or on biomass contribution and occurrence in the samples.
Generalized additive models (GAM) were used to fit trend lines to the time series using the mgvc package (Wood, 2006) in R (R Core Team, 2015). The models included a first order temporal autocorrelation term. Significance of the trend was determined by taking local slopes of the fitted model at equally spaced points in the time series and calculating the standard error and confidence intervals for each of the slopes using the covariance matrix of the parameters of the GAM model. Alpha was set to a conservative 0.01 to not over-interpret fluctuations or trends in these serial or autocorrelated data.
Time series are maintained under responsibility of three countries and conducted by different monitoring authorities. Although efforts have been made to harmonize the methodology (TMAP Monitoring Handbook Tidal Area – Macrozoobenthos, http://www.waddensea-secretariat.org/monitoring-tmap/manual-guidelines) continuous effort is needed to keep methodologies synchronized and the data of the different origins comparable.
Table Annex 1. Information on ongoing macrozoobenthos monitoring series in the Wadden Sea. Given are the region (Northeastern (NE) or Southeastern (SE) Wadden Sea), the habitat, monitoring layout and the period covered including missing years. Note that not all monitoring series are included in Wadden Sea wide and regional averages as indicated in the last column.

Annex 2
 Figure Annex 2. Total biomass (ash free dry mass) of the macrozoobenthos in winter/spring and summer/autumn at the long term monitoring sites in the Wadden Sea. Significant temporal trends are shown in bold line type. The monitoring areas indicated with an asterisk * are included in the Wadden Sea average. At the monitoring areas Nordfriesland and Dithmarschen new stations have been established. Results of these stations are added separately to the graphs and not included for trend analysis.
Annex 3
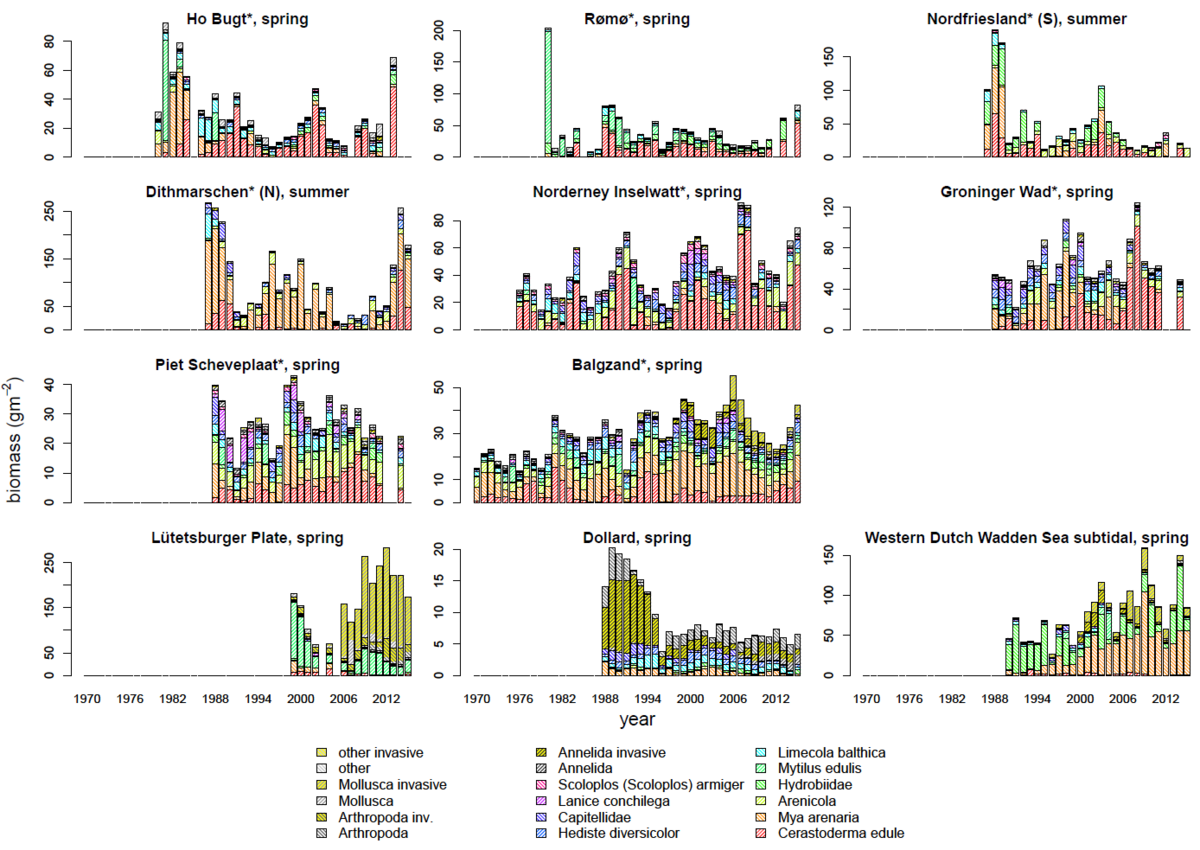
 Figure Annex 3. Distribution of biomass (ash free dry mass) among the ten macrozoobenthos taxa with largest biomass contributions and the summed biomass of the remaining taxa in the different monitoring areas in the Wadden Sea. The monitoring areas indicated with an asterisk * are included in the overall Wadden Sea and sub region averages presented in Figure 3.
Annex 4
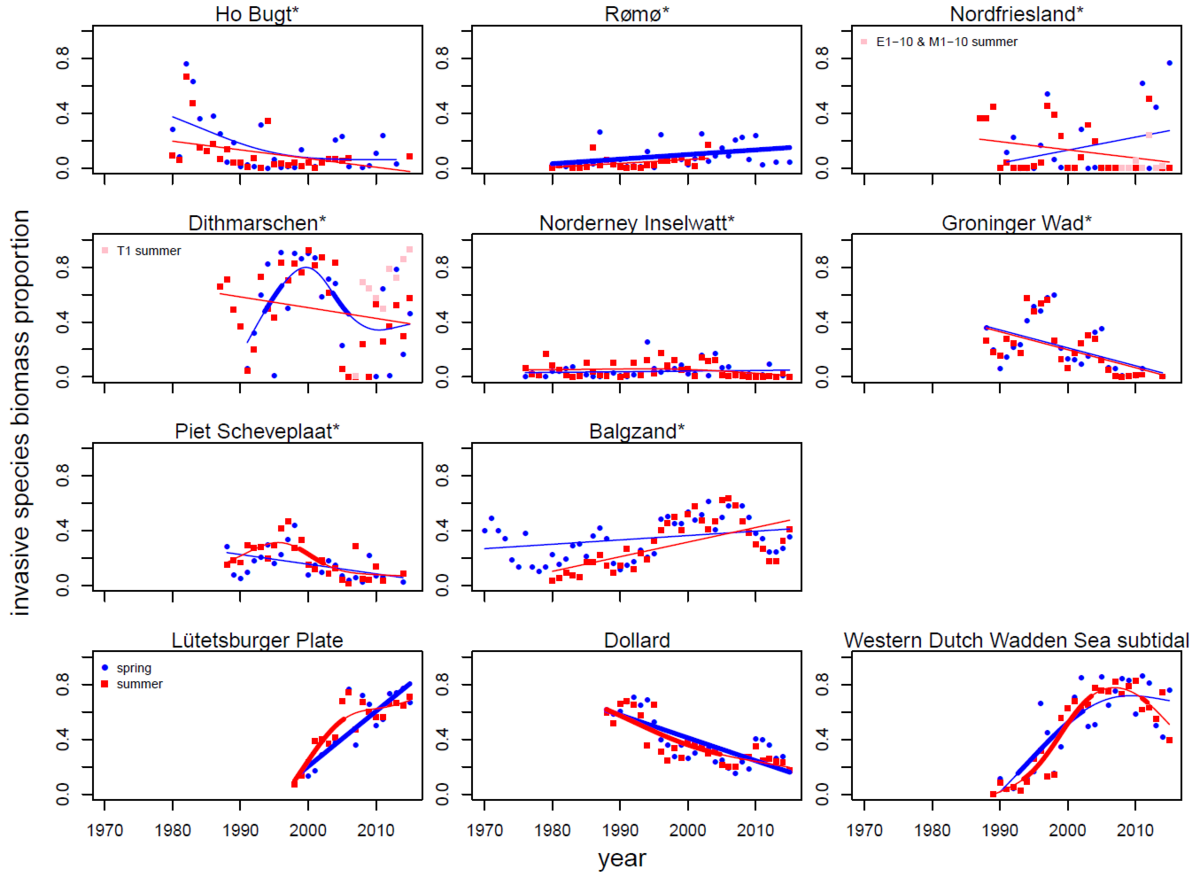
 Figure Annex 4. Proportional contribution of invasive species to the total macrozoobenthos biomass at the different long term monitoring areas in the Wadden Sea. A bold line type indicates significant temporal trends. The areas marked with an asterisk * are included for the Wadden Sea wide and sub region averages presented in Figure 5.
Annex 5
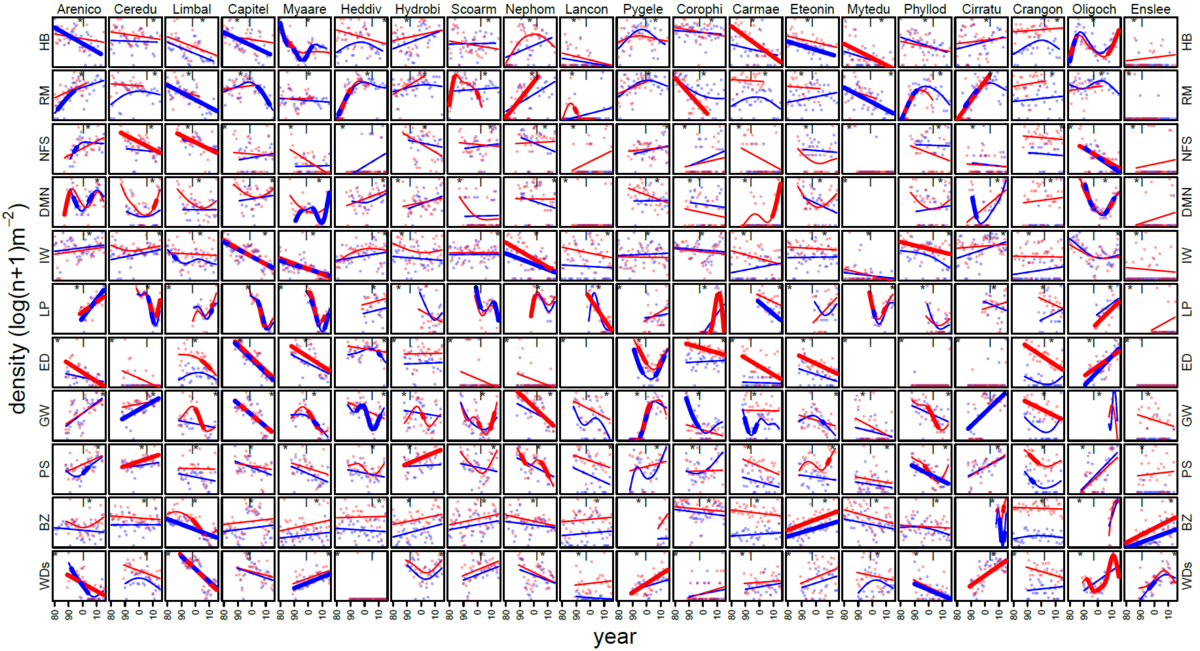
 Figure Annex. 5 Temporal development of numerical densities of the twenty most important macrozoobenthos taxa (full names in Table 2) in the Wadden Sea at 11 monitoring areas (full names in Table 1) since 1989 both in winter/spring (red symbols and lines) and in summer/autumn (blue symbols and lines). Significant temporal trends of macrozoobenthos are shown in a bold line type.
Annex 6
Dollard
 Figure Annex 6. Temporal development of average numerical densities of the 20 locally most important macrozoobenthos taxa in the Dollard monitoring area in winter/spring and in summer/autumn. Significant temporal trends are indicated by a bold line type.
At the three Dollard transects many of the dominant macrozoobenthos species of the Wadden Sea decreased significantly (Table 1). This was also true for the selection of the twenty locally most important species (Figure Annex 6) which were partly different from the Wadden Sea wide selection. Ten or nine (see below) species declined significantly after 2005 in at least one of the monitoring seasons, winter/spring or summer/autumn. Five or four species increased in the same period. These counts depend on the way the separate group Nereididae is treated. Nereididae are Hediste diversicolor and Alitta succinea not identified to the species level taken together at a higher taxonomic level. There are probably no other significant densities of additional unidentified Nereididae members. Distribution of H. diversicolor and A. succinea lumped will most likely remove the short term significant decline in the H. diversicolor winter densities and strengthen the positive trend of A. succinea. Negative numerical density trends were also observed for Corophiidae, the invasive Marenzelleria viridis, Limecola balthica, the ancient invader Mya arenaria, Capitellidae, Arenicola, Eteoninae, Crangon crangon and Carcinus maenas. The decline of the lugworm Arenicola has already been mentioned by Bos et al. (2012). The few taxa significantly increasing were Oligochaeta, Alitta succinea, Pygospio elegans after it first declined between 1990 and 2000 and Polydora cornuta.
The cause or causes of the declining densities of the large number of taxa in the Dollard monitoring area have not yet been specifically investigated. However, there is a general concern about the disturbance of the ecological functioning of the Ems-Dollard estuary (Bos et al., 2012; Baptist & Tamis, 2015). Hypothesis to be considered explaining these observations should at least include the human induced increased turbidity levels and dynamics in the Ems-Dollard estuary (De Jonge et al., 2014; Van Maren et al., 2016).
