
Annex "Marine litter"
Statistical and geostatistical methods applied for analysis of litter distribution on offshore seafloor (macrolitter IBTS-Data)
All data were statistically and partly geostatistically analysed. These analyses served to describe the extent of pollution with benthic litter in offshore regions of the southern North Sea, and to highlight potential spatial variability and temporal trends.
A detailed description of sampling by means of hauls is given in ICES (2012). Table A.1 gives the categorization applied in the ICES protocol. Material composition according to the mass of litter pieces was calculated on the basis of all samples from 2011 to 2015 (n = 397 hauls). Densities of total benthic macrolitter [kg km-2] were calculated for each haul.
Dederer et al. (2015) applied geostatistical Ordinary Kriging algorithms to each year of the sampling in the German Bight separately. Results of these evaluations are given in Figure A1. In the present study, only data from hauls in a spatial cluster in the centre of the German Bight were considered for geostatistical analyses (rectangle in Figure 1 of the thematic chapter; n = 40 hauls), because outside of this cluster, the spatial resolutions of the hauls were too low for the application of interpolation procedures. In this cluster, all data of the entire sampling period were merged and cleaned from outlying values of more than 250 kg km-2. Raw data and cleaned data were both subdued to Ordinary Kriging interpolations with spatial resolutions of 0.01 x 0.01 decimal degrees. Interpolated densities were integrated and divided by the total planar area of the cluster, in order to calculate mean densities of total benthic macrolitter. All geostatistical analyses were carried out with the geostatistical software Surfer 8.0 (Golden Software, USA, http://www.goldensoftware.com/products/surfer).
In addition, the entire dataset was cleaned from outliers with densities of more than 250 kg km-2. Raw data and data cleaned from outliers were both used to calculate mean densities and standard deviations for the entire North Sea for the complete sampling period from 2011 to 2015. Cleaned data were divided into datasets of sampling years and used as input data for box-whisker plots, in order to illustrate data variability and potential temporal trends.
Table A.1: Categorization applied in the ICES protocol
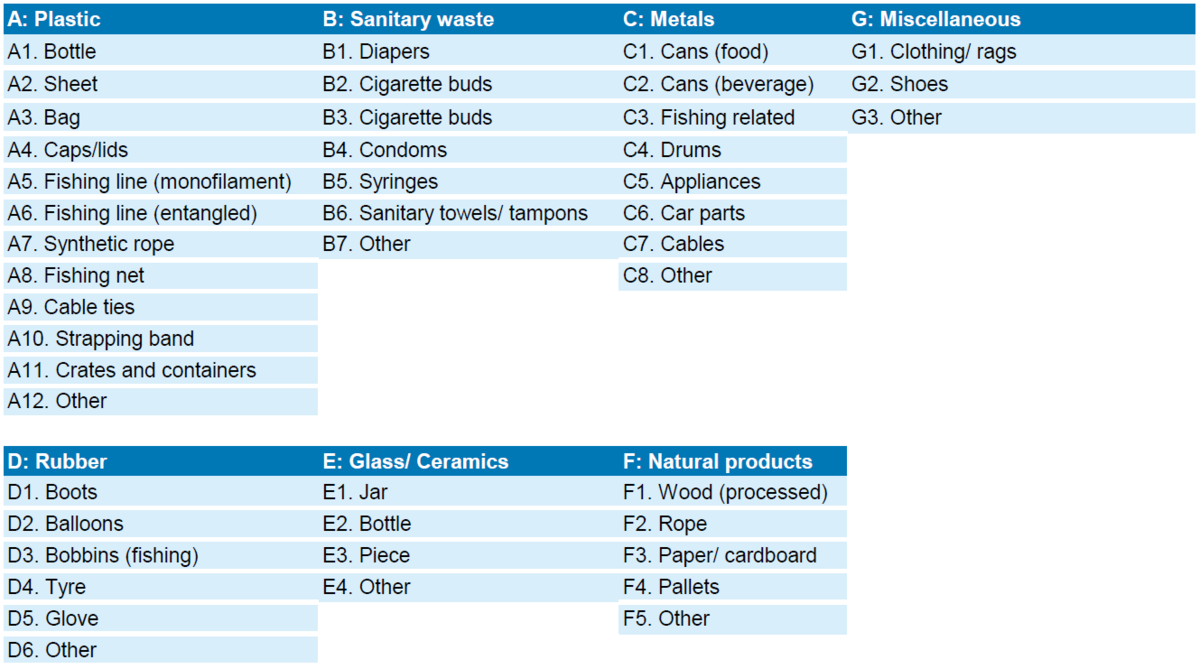
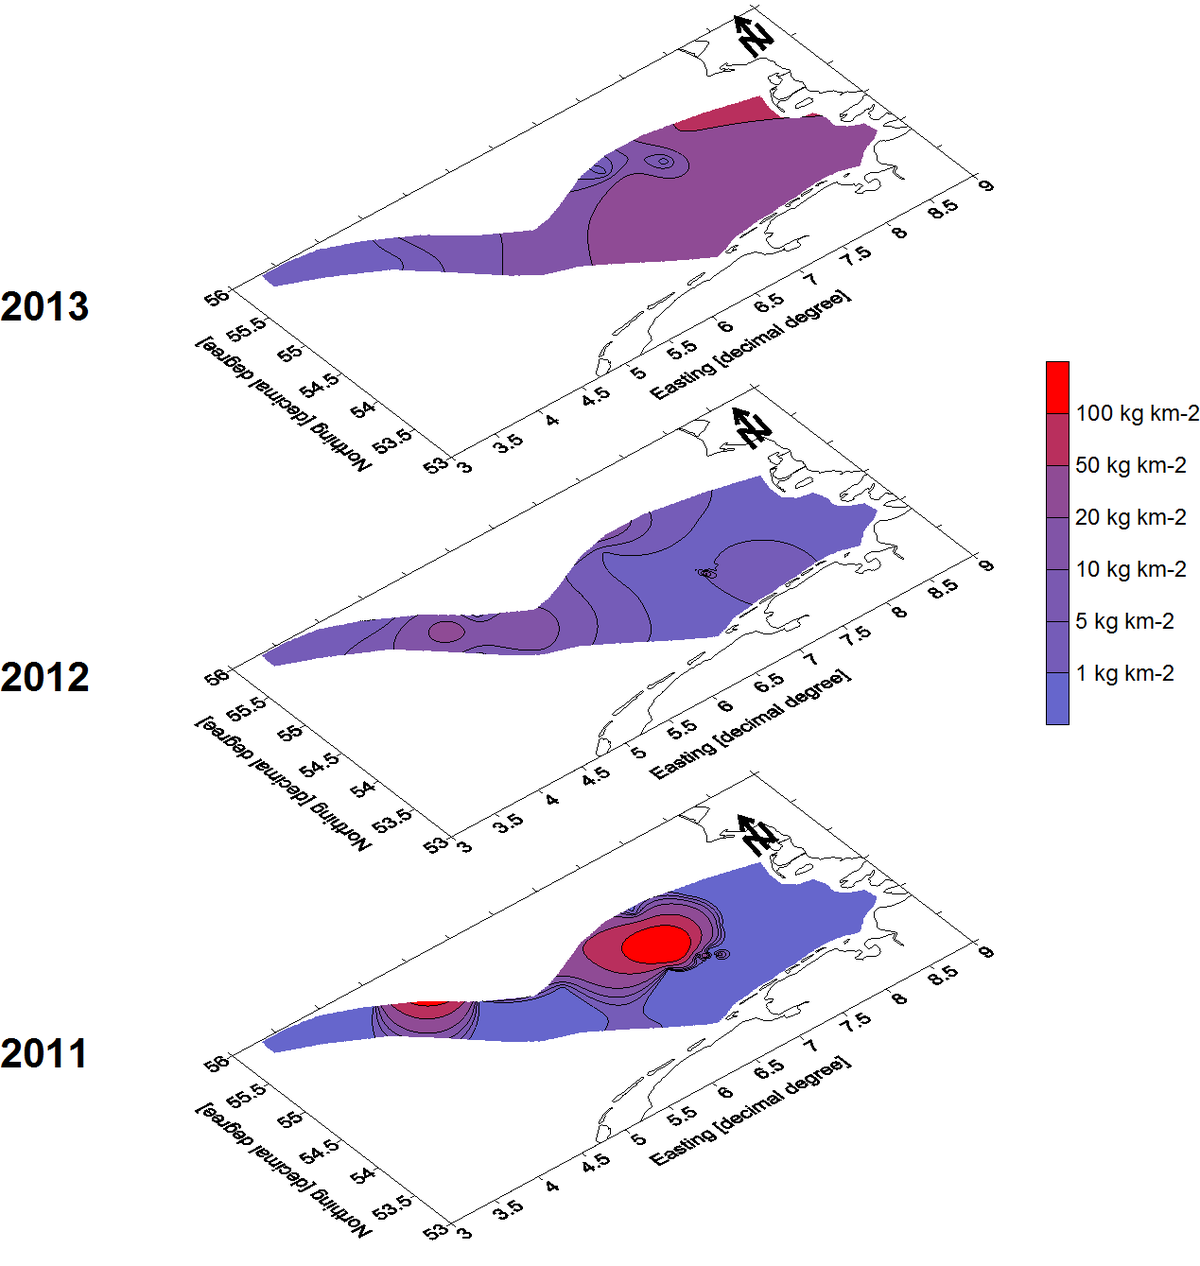
Figure A.1: Densities of total benthic macrolitter in the German Bight from 2011 to 2013 (from Dederer et al., 2015)