
Photo: Lars Malta Rasmussen. Bird watching in Guinea Bissau.
East Atlantic Flyway
M. van Roomen, C. van Turnhout, J. Blew, K. Koffijberg, S. Nagy, G. Citegetse, R. Foppen
Published 2017
1. Introduction
For many waterbird species, the Wadden Sea belongs to a large network of sites along the eastern shores of the Atlantic Ocean and adjacent seas, usually referred to as the East Atlantic Flyway (Figure 1). Individual birds and the populations to which they belong are using a larger or smaller part of this flyway and its sites for breeding, stop-overs and wintering. Hence, bird numbers and their conservation status will depend on the conditions at all sites within their distribution range in the East Atlantic Flyway. Therefore, important knowledge for the management and conservation of Wadden Sea birds also needs to be collected at sites where these birds stay when they are not present in the Wadden Sea. Knowledge of the welfare of total flyway populations to which the Wadden Sea birds belong is a key for the proper interpretation of trends and status of these birds within the Wadden Sea. Hence such information is highly needed for management and policy, in order to be able to review developments in the Wadden Sea in a wider context.
This context above is the rationale behind the importance of improved monitoring, research, management and conservation along the flyway for Wadden Sea birds. Increasing cooperation and involvement of the Wadden Sea community with the other countries along the flyway was an important request of the UNESCO World Heritage Committee when the Wadden Sea was inscribed on the World Heritage list in 2009. The Wadden Sea countries launched the Wadden Sea Flyway Initiative (WSFI) and the Flyway Vision (CWSS, 2014) and action plan to implement the UNESCO request in 2012. The Flyway Vision was adopted at the 12thTrilateral Ministerial Conference in 2014.
After a workshop with experts on research and monitoring along the flyway (Boere & van Roomen, 2011) it was concluded that integrated monitoring was one of the important priorities to enhance the knowledgebase for the management and conservation of Wadden Sea birds. As part of the WSFI activities a framework and programme outline for such an integrated monitoring was drafted, including monitoring of abundance, pressures and demographic drivers (van Roomen et al., 2013). For the monitoring both the flyway and site level was considered important. Comparison between flyway trends and site trends will tell us whether a trend is very site-specific and its drivers most likely to operate locally, or that trends are similar elsewhere and causes are primarily raised by developments on a higher geographical scale. During the first period of WSFI monitoring projects (2012-2015), priority was given to the improvement of the monitoring of bird abundance on flyway level. In this report we summarize the results (see also van Roomen et al., 2015) and will compare these with the most recent results of the breeding bird and migratory bird trends within the Wadden Sea (Koffijberg et al., 2016; Blew et al., 2016).
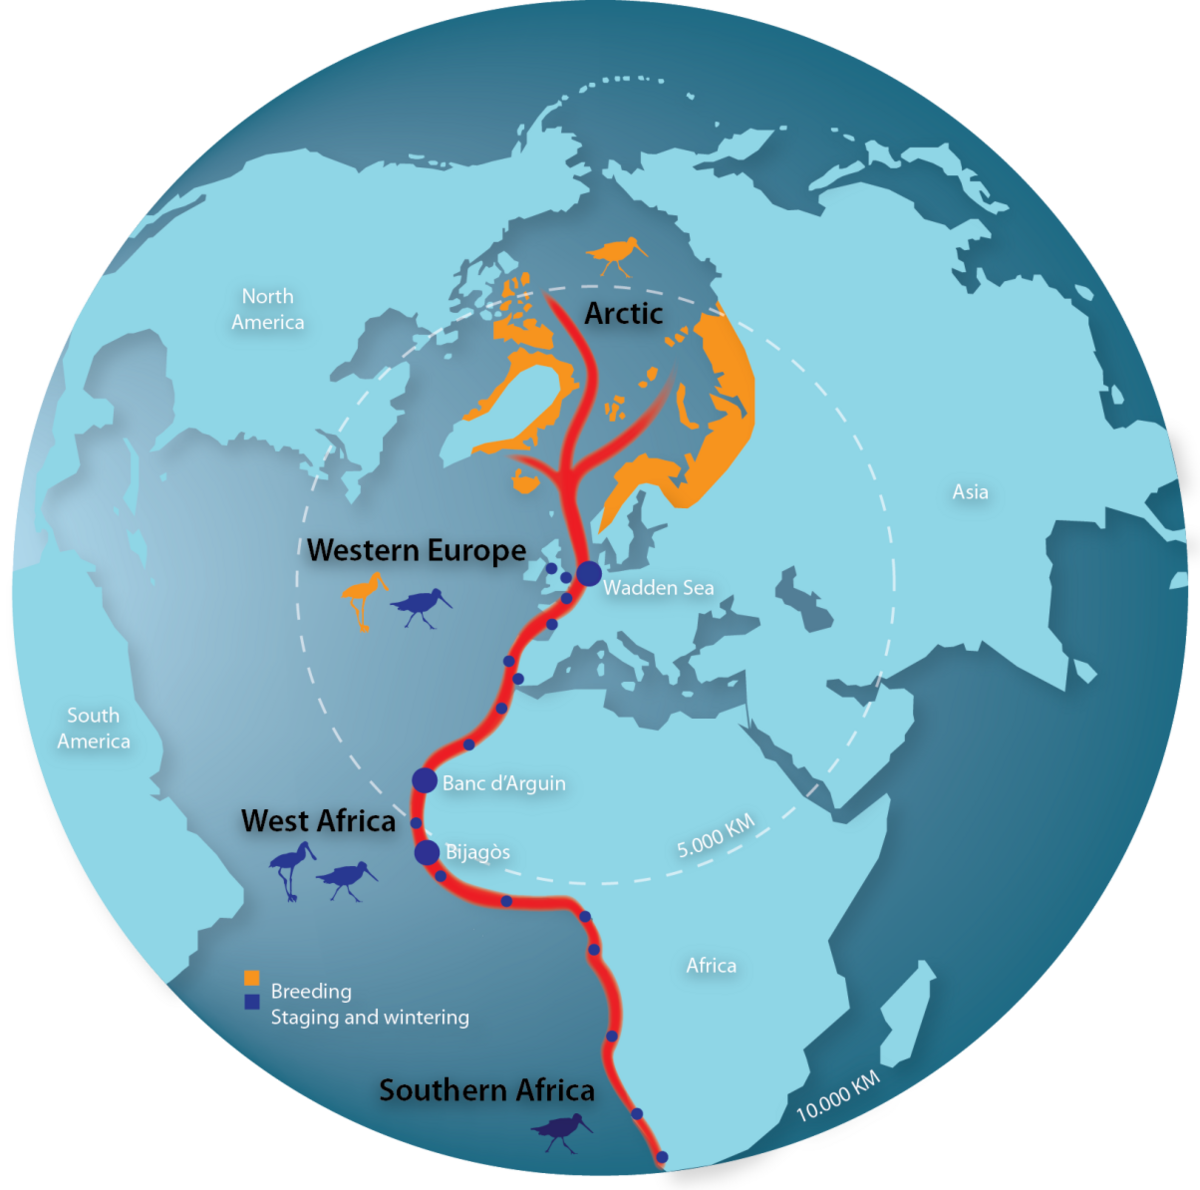 Figure 1. The East Atlantic Flyway. Breeding birds of the Arctic tundra between NE Canada and Siberia use a network of staging and wintering sites down to NW Europe and western and south Africa. There they mix up with local breeding birds which also use the same staging and wintering sites during their migration (Image: CWSS).
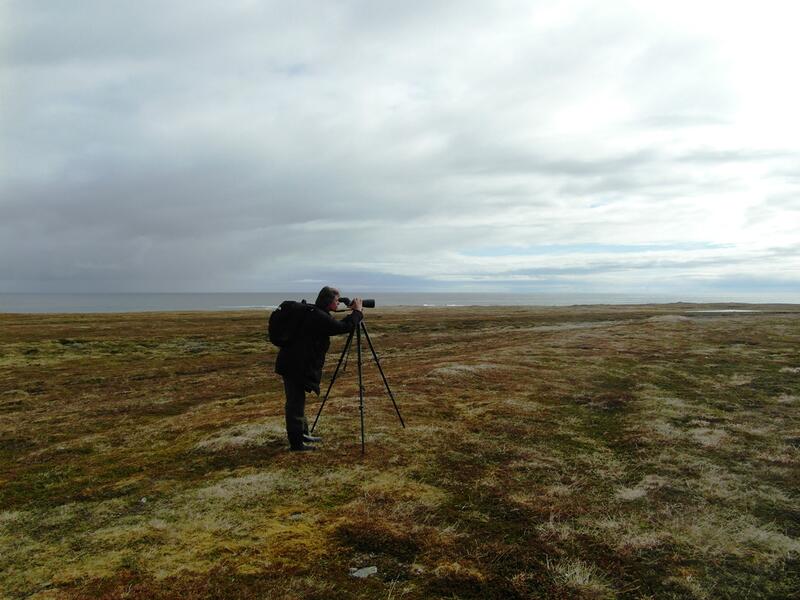

Figure 2. Different habitats used by arctic breeding waders during their annual cycle (clockwise): Arctic tundra, mudflats in the Wadden Sea and seagrass beds and mudflats at the Banc d’Arguin (Photos: Marc van Roomen, CWSS/ Bostelmann, Hans Schekkerman).
Monitoring along the East Atlantic flyway
January is traditionally the time that many waterbird species can best be monitored over large geographical ranges. During midwinter, migration between sites is limited and waterbirds from arctic and boreal breeding sites usually concentrate at specific and well-known wintering sites. A simultaneous survey effort, aiming for full coverage, also makes estimates of total numbers possible in this period. However for waterbird species that occur rather dispersed over many (smaller) wintering sites or in habitats difficult to survey, breeding bird counts may be a better source of information to establish population estimates. This applies to e.g. several colonial breeding bird species and for some common breeding birds in the temperate zone.
For the assessment of the status of Wadden Sea-relevant flyway populations we needed to use both data from wintering bird and breeding bird monitoring projects. In Table 1 the different projects, sources and types of data is summarized. A major extra input in the annual results of the International Waterbird Census (IWC as organised by Wetlands International) focusing on January counts of wintering waterbirds, consisted of the so called “total” count of January 2014 along the East Atlantic Flyway (van Roomen et al., 2015). Supplementary data were derived from the so-called Art.12 Birds Directive reporting within the EU (EEA, 2015) and the Birds in Europe 3 project (BirdLife International, 2015), on top of the annual data from the Pan European Common Breeding Birds monitoring (PECBMS, organized by the European Bird Census Council). At the same time all these winter surveys contribute to the monitoring of sites at national level as well. This site monitoring is feeding into the data requirements for the management of Nature 2000 sites, Ramsar sites and other site based programmes as for instance implemented for the Wadden Sea by the TMAP carried out by JMMB and JMBB (Blew et al., 2016, Koffijberg et al., 2015) and in several other sites and countries through the IBA monitoring programme as organized by BirdLife International. The mixture of data sources results in different types of flyway trends (Figure 3). For several breeding species a comparison of population levels during 1980, 2000 and 2012 was used (Birds in Europe 1, 2 and 3; Tucker & Heath, 1994; BirdLife International, 2004; BirdLife International, 2015). For a selection of these breeding species this trend was substantiated through the annual indices of the Common Breeding Bird Monitoring (EBCC/RSPB/BirdLife International/Statistics Netherlands, 2014). For wintering populations confined to Northwest Europe yearly estimations of January numbers were available (Nagy et al., 2014). For populations also wintering in Western Africa at present estimates in a selection of years are available. The results of the total count in 2014 could fortunately be compared with results from several expeditions in western Africa from around 1980 and around 2000 (see references in van Roomen et al., 2015). Annex 1 gives an overview which method was used for which population.
Table 1. Overview of monitoring schemes and projects as used for the flyway results. Indicated is the application for the breeding or wintering situation and for Western Europe or Western Africa. Also the type of monitoring and frequency is given and the organisation responsible for its principal organisation.
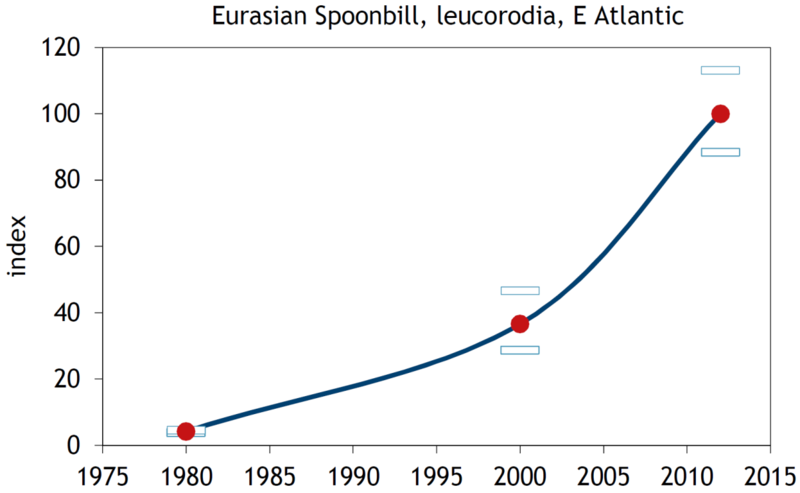
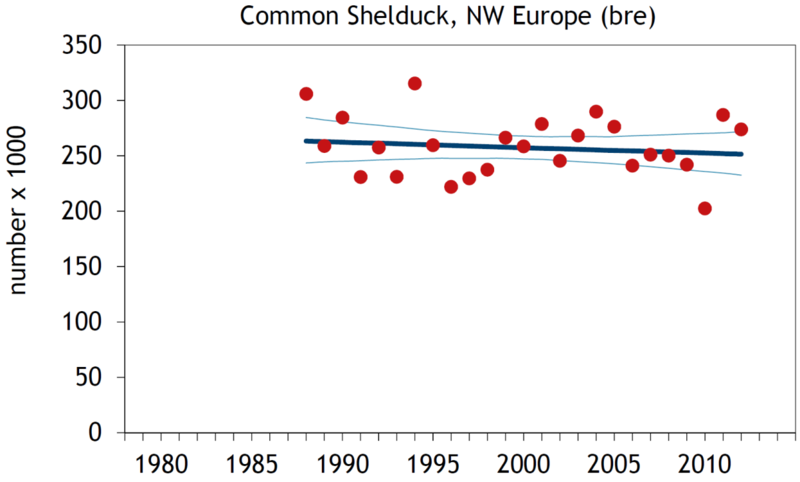
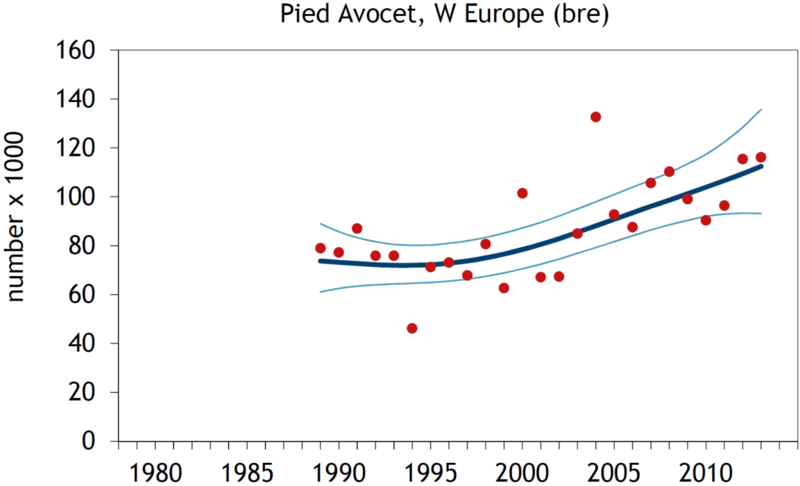
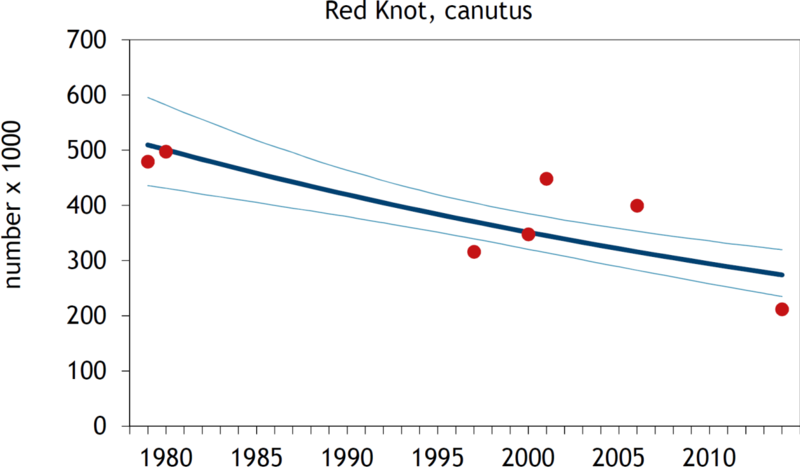

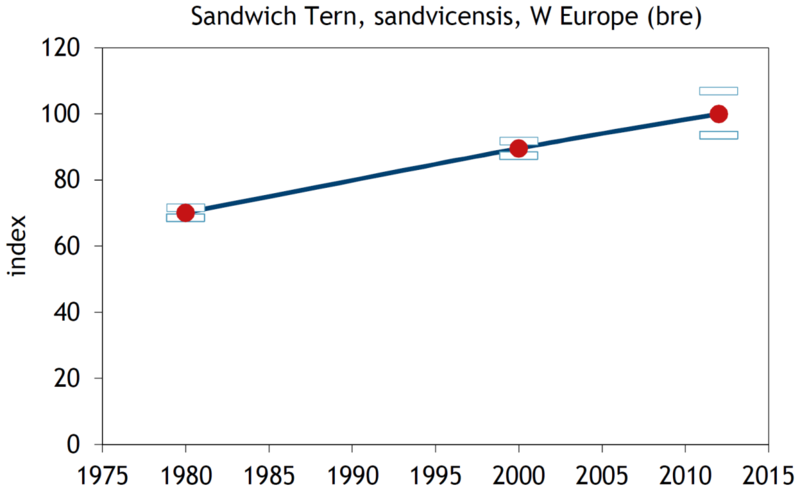
Figure 3. Some examples of flyway trends for Wadden Sea relevant populations: Eurasian Spoonbill (based on breeding birds, Birds in Europe project), Common Shelduck (IWC data), Pied Avocet (IWC data), Red Knot (canutus population, IWC data), Eurasian Curlew (based on breeding birds, Birds in Europe project; solid line and PECMBS data; dotted line) and Sandwich Tern (based on breeding birds, Birds in Europe project).
2. Status and trends
2.1. Flyway populations
Trends
Recent trends of flyway populations which are relevant to the Wadden (Figure 4) show a mixture of decreasing, stable and increasing species (see also Annex 1). Species showing increases or declines dominate over species with a stable trend, indicating that major environmental changes are going on along the flyway. While, around 2009, flyway trends for Wadden Sea relevant populations were lacking or very biased for about 40 % of the populations involved, the availability of more reliable flyway trends is now almost 100 %.
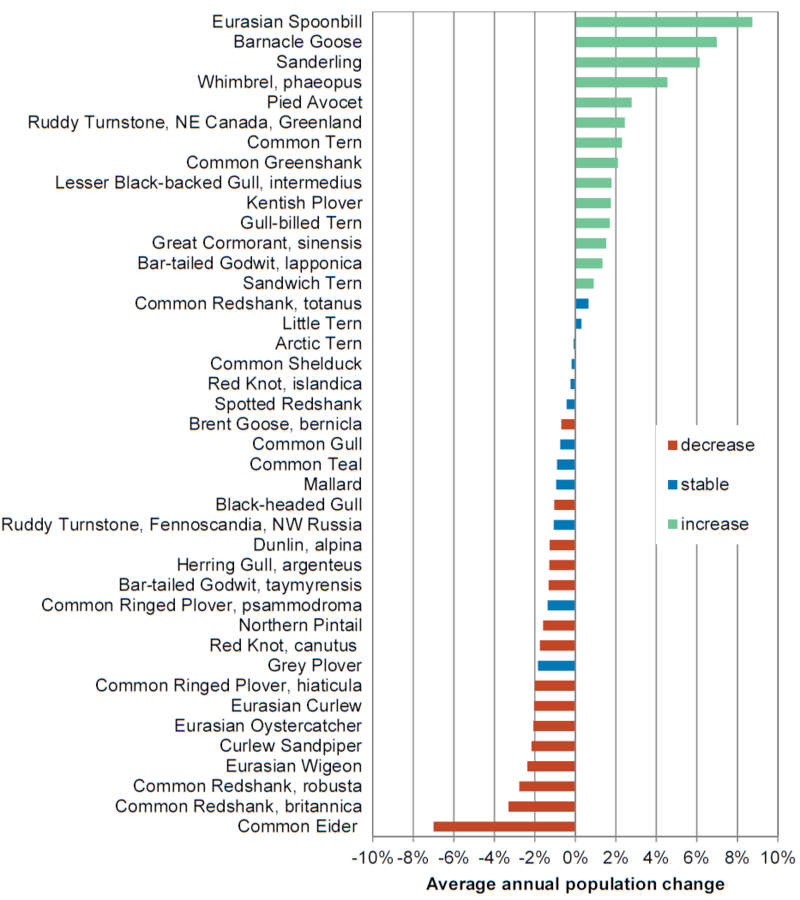
Figure 4. Summary of trends, expressed as average annual change in %, at the flyway level of Wadden Sea relevant populations calculated over the most recent ten years from the period 2000 – 2014 depending on data availability. Some species may appear more than once, as sub-populations (relevant in Wadden Sea context) were taken into account as well.
Population sizes and distribution
The estimated flyway population sizes of populations which use also the Wadden Sea to a larger or smaller extent ranges from relatively scarce, less than 25,000 birds (Eurasian Spoonbill) towards (more than) a million (Eurasian Wigeon, Dunlin, Barnacle Goose and Herring Gull), see Annex 1. The total number of waterbirds of the East Atlantic flyway of populations which are also relevant in Wadden Sea context amounts to almost 24 million in 2014. Aggregated into food guilds, benthivore species are most numerous followed with a large distance by herbivores and piscivore species (Table 2). It is especially among these benthivore populations where large declines are apparent. Since 2003 their numbers were reduced by 2.5 million birds, whereas herbivores declined slightly and piscivores increased a little (Table 2).
Table 2. Changes between 2003 and 2014 in estimated total flyway population sizes of piscivore populations (n=9 ), benthivore populations (n=27 ) and herbivore populations (n= 5) for which the Wadden Sea is important. Changes were calculated by combining recent population sizes with the trends in Figure 3. See Annex 1 for diet choice.
Within the East Atlantic Flyway rather different distribution patterns emerge, ranging from mainly wintering in NW Europe to mainly wintering in Western Africa and also populations wintering in both Europe and Africa (Figure 5). Also during the breeding season distribution patterns can be rather different with high arctic, boreal or temperate breeders, and combinations of these. So the use of sites along the flyway will differ enormously between populations, so will be the environmental circumstances they encounter during their annual cycle.
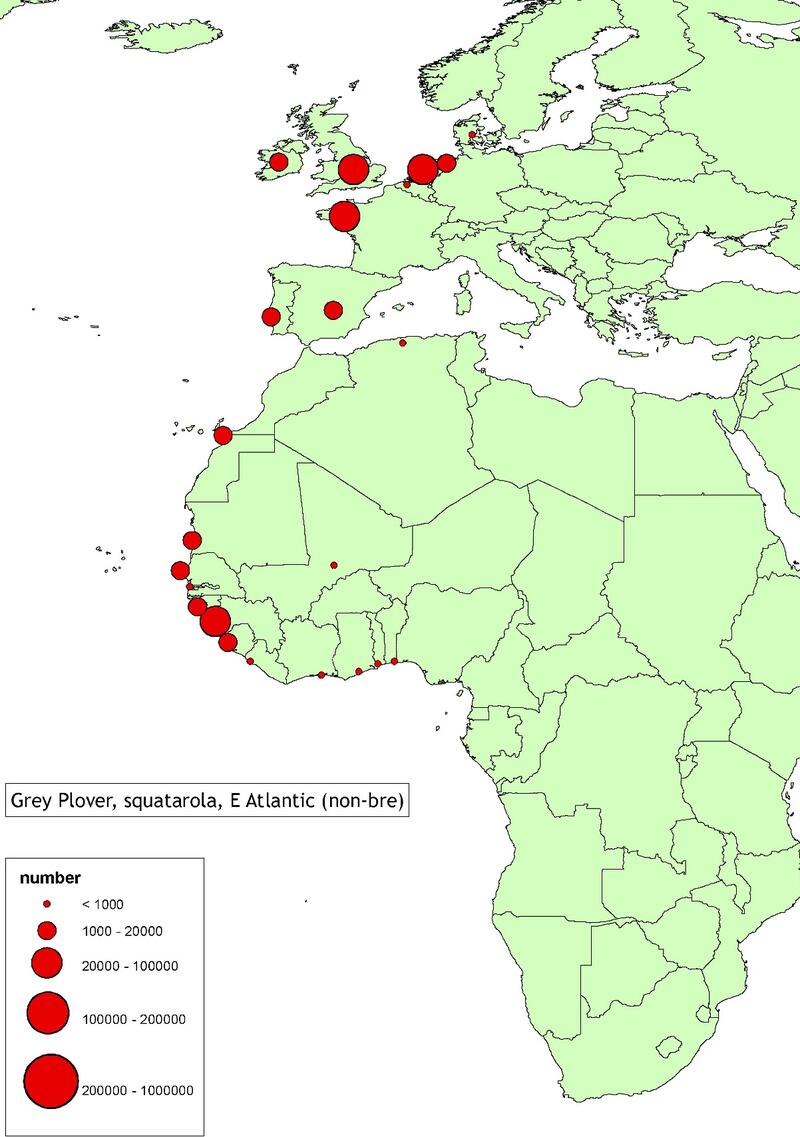
Figure 5. Examples of flyway distribution during winter 2012-2014 of Wadden Sea relevant populations of Eurasian Wigeon and Grey Plover. Given is the total number per country.
2.2. Comparison of flyway results and Wadden Sea results
Trends
For benthivore populations, Van Roomen et al. (2015) found that (1) there was no correlation between Wadden Sea trends and flyway trends, indicating that local drivers are primarily responsible for the Wadden Sea trends instead of global ones (when global drivers are dominating, the trends at different sites will be the same and a good correlation between site trends and flyway trends found), and (2) trends in the Wadden Sea were more negative than trends of the same populations at the flyway level, indicating that these local Wadden Sea drivers had especially negative impacts.
However, in that publication Wadden Sea trends up to 2011 were analysed. These have now been updated until 2013 (for breeding birds, Koffijberg et al., 2016) or winter season 2013/14 (for staging and wintering birds, Blew et al., 2016). It is therefore important to analyse if these conclusions still hold while using these more recent data from the Wadden Sea. In addition to the earlier analyses, we now investigate in more detail the comparison of Wadden Sea trends with flyway trends separately for the breeding populations and the stopover and/or wintering populations making use of the Wadden Sea. To avoid interference with both datasets, counts in months when also breeding takes place of the population involved where excluded from the trend analyses of stopover and wintering birds in the Wadden Sea (Annex 1).
Using this new data for the Wadden Sea the trends in benthivore breeding populations show still no significant relationship with their trends at the flyway level (R2=0.032, p=0.27, n=12; Figure 6A), as was found in earlier analyses. Moreover, trends in Wadden Sea breeding bird populations are more negative compared to the trends in the respective total flyway. (non-parametric Wilcoxan test; p=0.05) This suggests that there are local drivers in the Wadden Sea that primarily have negative effects. Also the trends in non-breeding populations of benthivores in the Wadden Sea show still no significant relationship with their flyway trends (R2=0.066, p=0.11, n=25; Figure 6B). Contrary to breeding birds, however, population trends of staging and wintering benthivores in the Wadden Sea do not show significant differences between negative or positive directions when compared to flyway trends (as was found in the earlier analyses) (non-parametric Wilcoxan test, p=0.73).
Van Roomen et al. (2015) also found that in benthivores which rely on the Wadden Sea to a large extent, a higher proportion of flyway populations was decreasing, compared to populations using the Wadden Sea to a small extent or not occurring there al all. When we calculate this relation as the average trend per category of Wadden Sea utilisation, the results points in the same direction (Figure 7), but the differences detected previously are not significant (non-parametric Wilcoxan test, p=0.28) due to large variation between the trends of populations relying on the Wadden Sea. So the relation between the extent that the Wadden Sea is used and the chance that that population is in decline is not so clear-cut as has been suggested earlier.
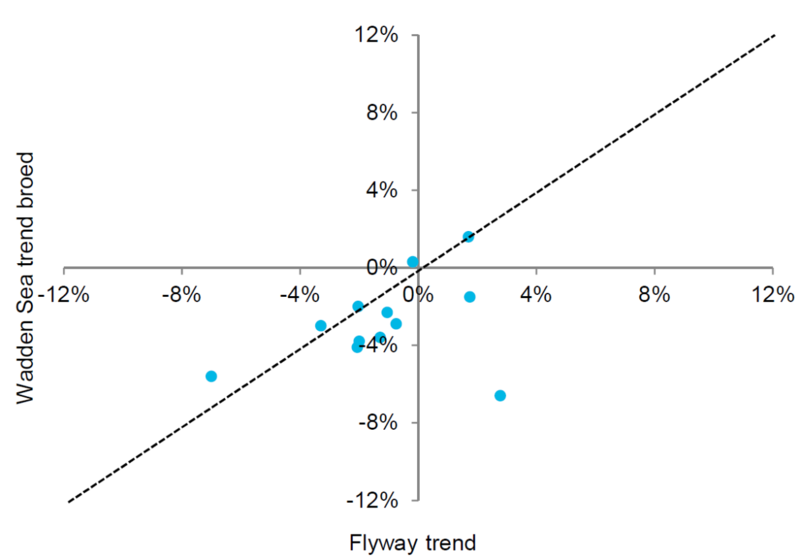
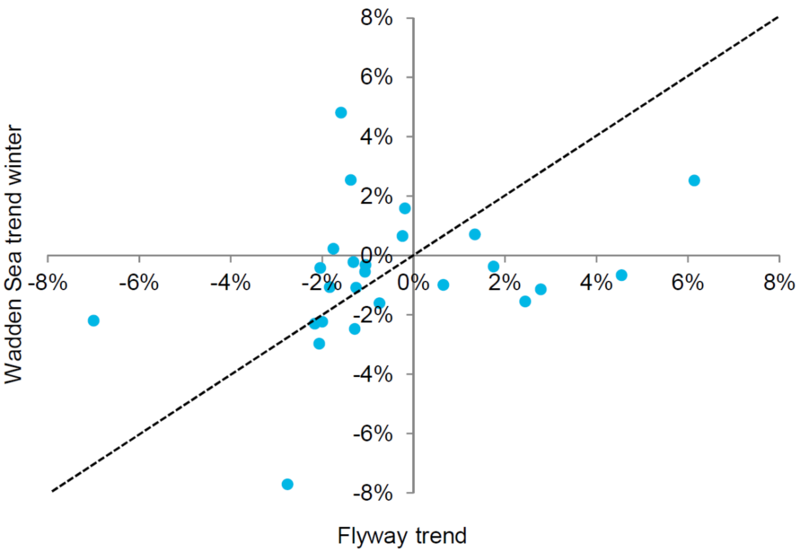
Figure 6. Flyway trends compared with Wadden Sea trends for benthivore species, (A) with breeding population trends in the Wadden Sea (B) with stop-over and wintering population trends in the Wadden Sea. The flyway trend (average annual change, positive is increase, negative is decrease) is on the x-axis, the Wadden Sea trend (expressed in the same way as flyway trend) is on the y-axis. Dots are placed on the position were flyway trend and Wadden Sea trend are crossing each other. The dotted line is the y = x, when the trend at the flyway is the same as in the Wadden Sea dots will be on this line. Dots under this line indicates that the trend at the flyway is more positive than at the Wadden Sea. Dots above this line indicates Wadden Sea trends more positive than flyway trends.
 Figure 7. The average flyway trend (% increase or decrease per year with SE) in relation to the extent in which the Wadden Sea is used during their annual cycle. No use (n=6), little use (n=11) and large use (n=14). Despite the average decline in populations using the Wadden Sea to a large extent and the increase in populations using the Wadden Sea to a small extent or not al all, the difference between the categories of Wadden Sea use is not statistically significant.
To get a more complete overview of all feeding guilds we investigated the differences in average flyway and Wadden Sea trends according to diet for the major food groups. Food guilds distinguished were herbivores and piscivores whereas benthivores were separated in shellfish-, polychaete- and other benthos-eaters (Figure 8). The benthivores show mainly declines, most pronounced in the shellfish- eaters. However, the differences between the average flyway trends and Wadden Sea trends are not significant (shellfish p=0.63, n=5, polychaete p=0.91, n=9, other benthos eaters p=0.54, n=13, non-parametric Wilcoxan tests). Average trends of herbivores are positive but without significant difference between flyway and Wadden Sea populations (p=1.00, n=5). The biggest differences between flyway trends and Wadden Sea trends appear in piscivores in which the average trend on flyway level is positive while it is negative in the Wadden Sea. This difference is significant (p=0.0195, n=9). For instance Wadden Sea trends for breeding Common Tern, Arctic Tern, Little Tern and Sandwich Tern are negative while the flyway trend is stable or positive.
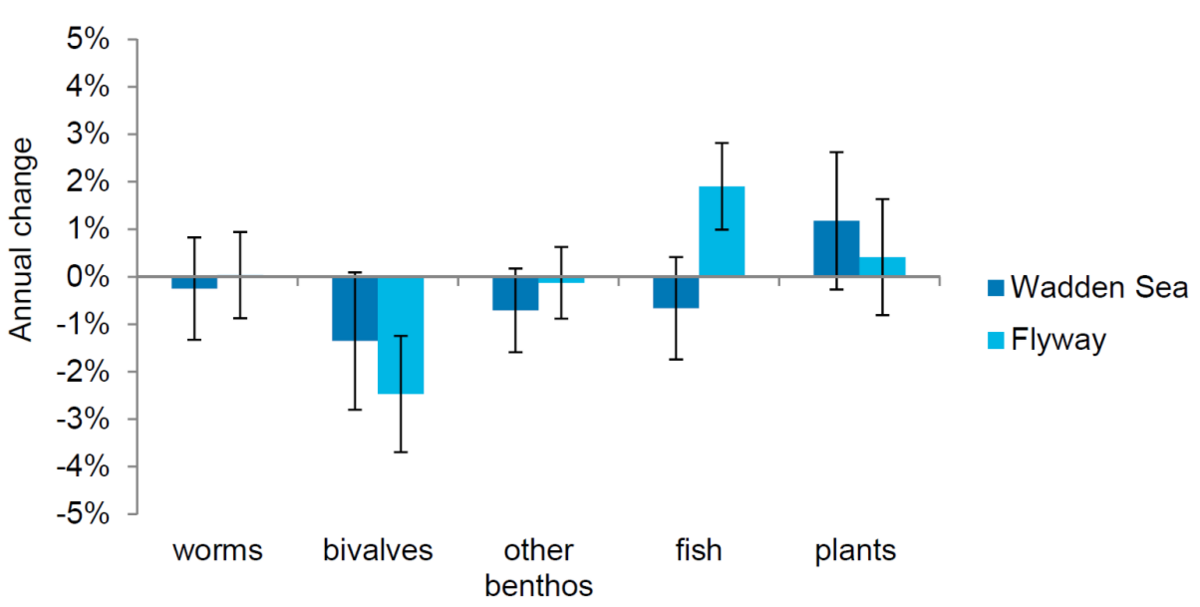 Figure 8. The average flyway trend and Wadden Sea trend (% increase or decrease per year with SE) in relation to diet. See Annex 1 for allocation of species to diet.
Total numbers
When comparing the most recent estimates of total numbers using the Wadden Sea (Blew et al,. 2016) with those which have been estimated for total flyways (van Roomen et al., 2015) it becomes clear that the Wadden Sea for many species still serves as a very important staging or wintering area (Figure 9), even if numbers in several (sub-)populations went down in recent years. This is even more apparent if we realise that this are minimum estimates in which turn-over is not incorporated (Loonstra et al., 2016). Hence, the Wadden Sea countries have a huge and ongoing international responsibility for migratory bird populations.
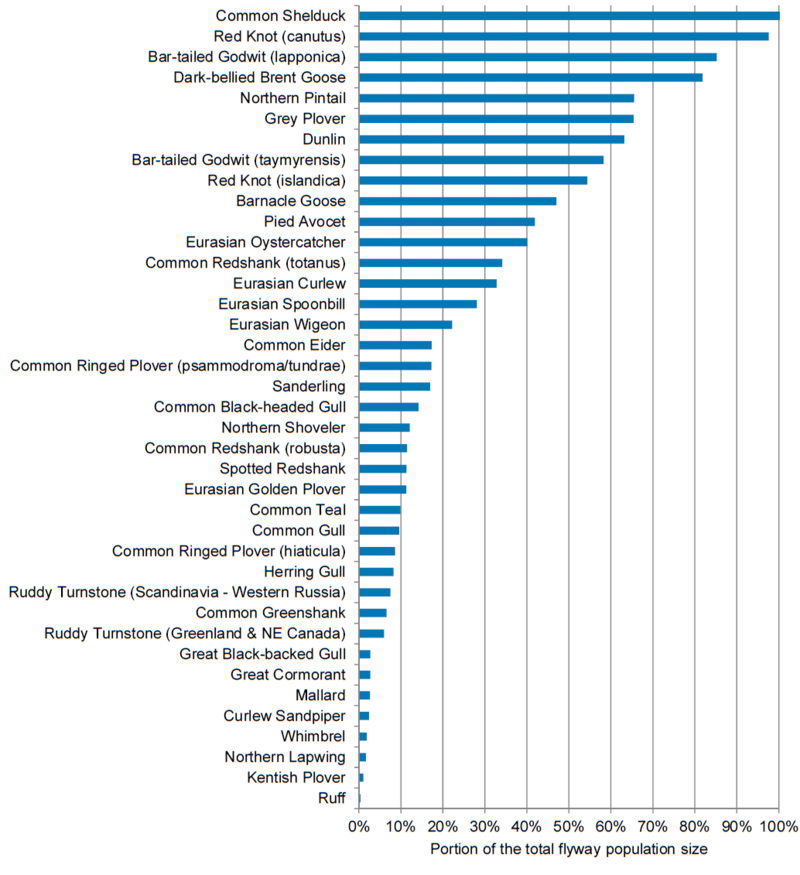
Figure 9. Average proportions of total flyway population sizes making use of the Wadden Sea during their presence with maximum numbers. For the Wadden Sea data from 2009/10 – 2013/14 was used (Blew et al., 2016) and compared with flyway estimates (van Roomen et al. 2015, see Annex 1). Some species may appear more than once, as sub-populations (relevant in Wadden Sea context) were taken into account as well.
3. Assessment
Conclusions:
- Despite some large decreases in the Wadden Sea this area still holds major proportions of the flyway populations again showing the huge international responsibility for their welfare.
- Trends in bird numbers, differentiated according to food guilds, show huge dynamics, with many species subject to either increasing or decreasing populations in both the East-Atlantic Flyway and the Wadden Sea. These findings suggest changes in environmental conditions, affecting e.g. survival and/or reproduction of species involved.
- Both, flyway trends and Wadden Sea trends for benthivore populations, are dominated by declines, most pronounced in shellfish-eating populations.
- Comparison of flyway trends with Wadden Sea trends in benthivores indicates that trends within the Wadden Sea are mainly driven by local factors. This is both true for the breeding bird populations and the migratory populations using the Wadden Sea as a stop-over or for wintering area. In breeding birds the local factors in the Wadden Sea have on average a more negative effect than the sum of drivers operating along the flyway in total. In the non-breeding populations the effects of local drivers in the Wadden Sea are not more negative or positive than within the flyway.
- Herbivores, depending on salt marshes but often also relying on agriculture areas are showing increases both at flyway and Wadden Sea level, without significant differences.
- Piscivores, relying mostly on the subtidal habitats and adjacent seas, are generally doing well along the flyway but have undergone declines in the Wadden Sea. This is especially true for breeding Tern species within the Wadden Sea.
4. Recommendations
- While the availability of flyway trends and estimates of flyway population sizes have substantially improved as a result of the WSFI/WI/BLI cooperation and already important signals in relation to the conservation and management of the Wadden Sea can be given, the quality of the trends needs further improvement as some conclusions are based on only few data points. This stresses the importance of continued monitoring, as with more sites and more years added to the monitoring network the quality of the population trends will increase.
- As the total count of January 2014 showed important changes in numbers of several populations, especially also for populations wintering in West Africa, which could be the results of an exceptional year with low number but also the start of acceleration of decreasing trends, it is recommended that the next total count will be organised rather quickly.
- Besides data on numbers during January for flyway monitoring, also increased availability of simultaneous counts of breeding birds is needed. It is recommended that especially the simultaneous monitoring of a number of colonial waterbird populations on flyway level will be improved (Terns, Gulls, Cormorant).
About the authorsM. van Roomen1,2, C. van Turnhout1, J. Blew3,4, K. Koffijberg1,5, S. Nagy6, G. Citegetse7, R. Foppen1,8 1 Sovon, Dutch Centre for Field Ornithology, Toernooiveld 1, 6525 ED Nijmegen, NL 2 Wadden Sea Flyway Initiative c/o Common Wadden Sea Secretariat, Virchowstr. 1, 26382 Wilhelmshaven, DE 3 BioConsult SH, Schobüller Str. 36, 25813 Husum, DE 4 Joint Monitoring Migratory Birds Wadden Sea (JMMB) c/o Common Wadden Sea Secretariat, Virchowstr. 1, 26382 Wilhelmshaven, DE 5 Joint Monitoring Breeding Birds Wadden Sea (JMBB) c/o Common Wadden Sea Secretariat, Virchowstr. 1, 26382 Wilhelmshaven, DE 6 Wetlands International, P.O. Box 471, 6700 AL Wageningen, NL 7 BirdLife International, The David Attenborough Building, 1st Floor, Pembroke Street, Cambridge, CB2 3QZ, UK 8 European Bird Census Council, P.O. Box 6521, 6503 GA Nijmegen, NL |
AcknowledgementsCounts of breeding and wintering birds in the flyway are carried out by a large number of birdwatchers, rangers of nature reserves, field workers of research institutes and conservation and management agencies, both governmental and non-governmental. For the total count of January 2014 it was estimated that 1,500 observers were involved. For the breeding bird surveys this will be in the same order of magnitude. Each country is coordinated by a national coordinator, both for wintering and breeding birds separately. The flyway results are based on the work of national coordinators in 32 countries. We thank them all. The flyway coordination and support of the total count 2014 was funded by the Programme Rich Wadden Sea in the Netherlands on behalf of the Ministry of Economic Affairs with additional co-funding from BirdLife International, Wetlands International, MAVA, Vogelbescherming Nederland, WWF the Netherlands, Government of Niedersachsen, National Park Wattenmeer Niedersachsen and the WeBs programme in the UK. |
References
BirdLife International (2004). Birds in Europe, population estimates, trends and conservation status. Cambridge, UK: BirdLife International. (BirdLife Conservation Series No. 12).
BirdLife International (2015) Euroean Red List of Birds. Luxembourg. Office for Official Publications of the European Communities.
Blew, J., Günther, K., Hälterlein, B., Kleefstra, R., Laursen, K., Scheiffarth, G. (2016) Trends of Migratory and Wintering Waterbirds in the Wadden Sea 1987/1988 - 2013/2014. Wadden Sea Ecosystem No. 37. Common Wadden Sea Secretariat, Joint Monitoring Group of Migratory Birds in the Wadden Sea, Wilhelmshaven, Germany.
Boere, G.C & van Roomen, M. (2011) The Wadden Sea. Strengthening Management and Research along the African Eurasian Flyway. Workshop Report, Wilhelmshaven 2011. Common Wadden Sea Secretariat. Wilhelmshaven. Germany.
CWSS (2014) 12th Trilateral Governmental Conference on the Protection of the Wadden Sea. Ministerial Council Declaration, Tønder, 2014. https://www.waddensea-worldheritage.org/resources/2014-t%C3%B8nder-decl… (accessed on 14 June 2017).
EBCC/RSPB/BirdLife International/Statistics Netherlands 2014
EEA (2015) State of nature in the EU. Results from reporting under the nature directives 2007-2012. EEA Technical report no 2/2015. European Environment Agency, Copenhagen. Denmark.
Koffijberg, K. Laursen, B. Hälterlein, G. Reichert, J. Frikke & L. Soldaat (2015) Trends of Breeding Birds in the Wadden Sea 1991 - 2013. Wadden Sea Ecosystem No. 35. Common Wadden Sea Secretariat, Joint Monitoring Group of Breeding Birds in the Wadden Sea, Wilhelmshaven, Germany
Loonstra A.H. J., Piersma T & Reneerkens J. (2016) Staging duration and passage population size of Sanderlings in the western Dutch Wadden Sea. Ardea 104 (1).
Nagy, S., Flink, S., Langendoen, T. (2014) Waterbird trends 1988-2012: Results of trend analyses of data from the International Waterbird Census in the African-Eurasian Flyway. Wetlands International, Ede, The Netherlands
van Roomen M., Delany S. & Schekkerman H. (2013) Integrated monitoring of coastal waterbird populations along the East Atlantic Flyway. Framework and programme outline for Wadden Sea and other populations. Programme Rich Wadden Sea, Leeuwarden, The Netherlands and Common Wadden Sea Secretariat, Wilhelmshaven, Germany. https://www.waddensea-worldheritage.org/resources/integrated-monitoring…
van Roomen M., Nagy S., Foppen R., Dodman T., Citegetse G. & Ndiaye A. (2015) Status of coastal waterbird populations in the East Atlantic Flyway. With special attention to flyway populations making use of the Wadden Sea. Programme Rich Wadden Sea, Leeuwarden, The Netherlands, Sovon, Nijmegen, The Netherlands, Wetlands International, Wageningen, The Netherlands, BirdLife International, Cambridge, United Kingdom, & Common Wadden Sea Secretariat, Wilhelmshaven, Germany. https://www.waddensea-worldheritage.org/resources/status-coastal-waterb…
Tucker, G. M. & Heath M. F. (1994). Birds in Europe: their conservation status. Cambridge UK, BirdLife Conservation Series no 3.
This report should be cited as: van Roomen, M., van Turnhout, C., Blew, J., Koffijberg, K., Nagy, S., Citegetse, G., & Foppen, R. (2017). Wadden Sea Quality Status Report: East Atlantic Flyway. Common Wadden Sea Secretariat. https://doi.org/10.5281/zenodo.15221429
All 2017 reports may be cited collectively as: Kloepper, S., Baptist, M. J., Bostelmann, A., Busch, J.A., Buschbaum, C., Gutow, L., Janssen, G., Jensen, K., Jørgensen, H.P., de Jong, F., Lüerßen, G., Schwarzer, K., Strempel, R., & Thieltges, D. (2017). Wadden Sea Quality Status Report. Common Wadden Sea Secretariat, Wilhelmshaven, Germany. Downloaded DD.MM.YYYY. qsr.waddensea-worldheritage.org


