Photo: CWSS/ Bostelmann. Sandy mudflat.
Climate change
A. P. Oost, J. Hofstede, R. Weisse, F. Baart, G. Janssen, R. Zijlstra
Published 2017
1. Introduction
This report provides newest insights on climate change and related effects for the Wadden Sea area. After general information in section 1, “Status and Trends” are discussed in section 2 :
- Temperature change;
- Solar radiation, precipitation, evaporation and drought;
- Sea-level rise;
- Wind, storms, wave conditions and storm surges.
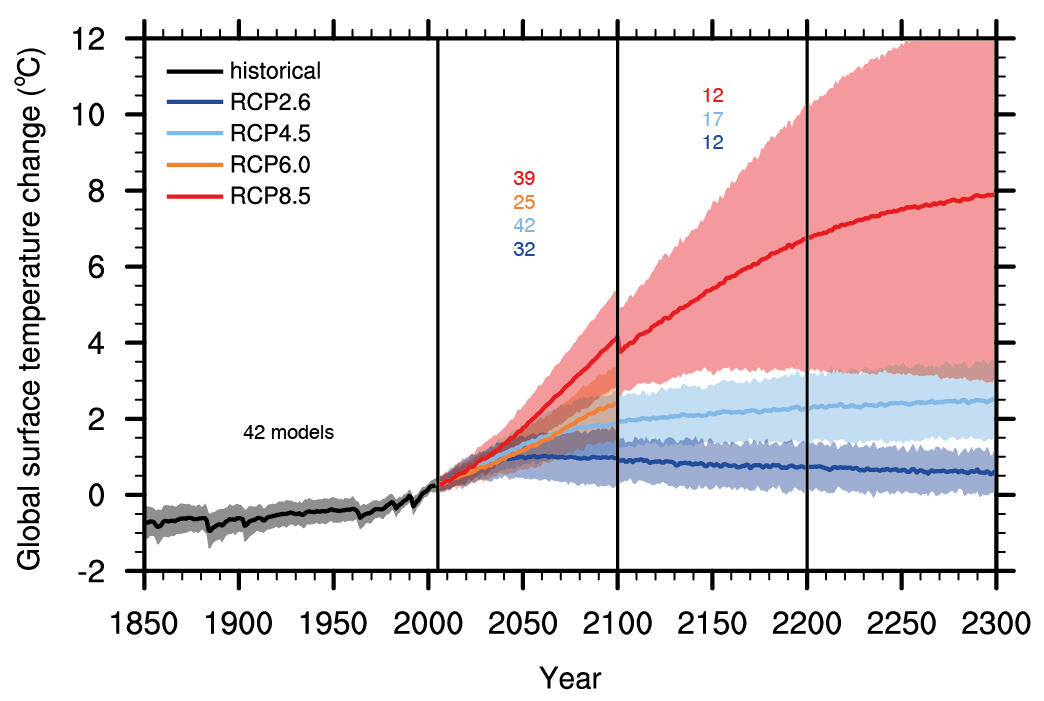
First, the observed changes are discussed; subsequently projections for the Wadden Sea up to 2100 are outlined. In the annexes, new global insights are discussed by citing, where possible, the most recent IPCC’s AR5-assessment report (IPCC, 2013, 2014) for each subsection. In this way, a comparison between the IPCC studies and the local studies for the Wadden Sea area is made possible. In addition, results are discussed, leading to recommendations for research, monitoring and management (section 3). A short summary is given in section 4.
It should be realized that the effects of climate change influence both, the physical and the biotic system. Often, several natural effects in combination with human-induced pressures exert their influence on the same element of a system. Therefore, the influences of various possible effects of climate change in combination with human induced effects on the physical and biotic system are discussed separately (sub-section 2.5). Figure 1 gives a comprehensive overview of these coupled influences. For the combined effects of climate change on the physical and biotic system, the reader is referred to the relevant reports in this Quality Status Report (QSR).
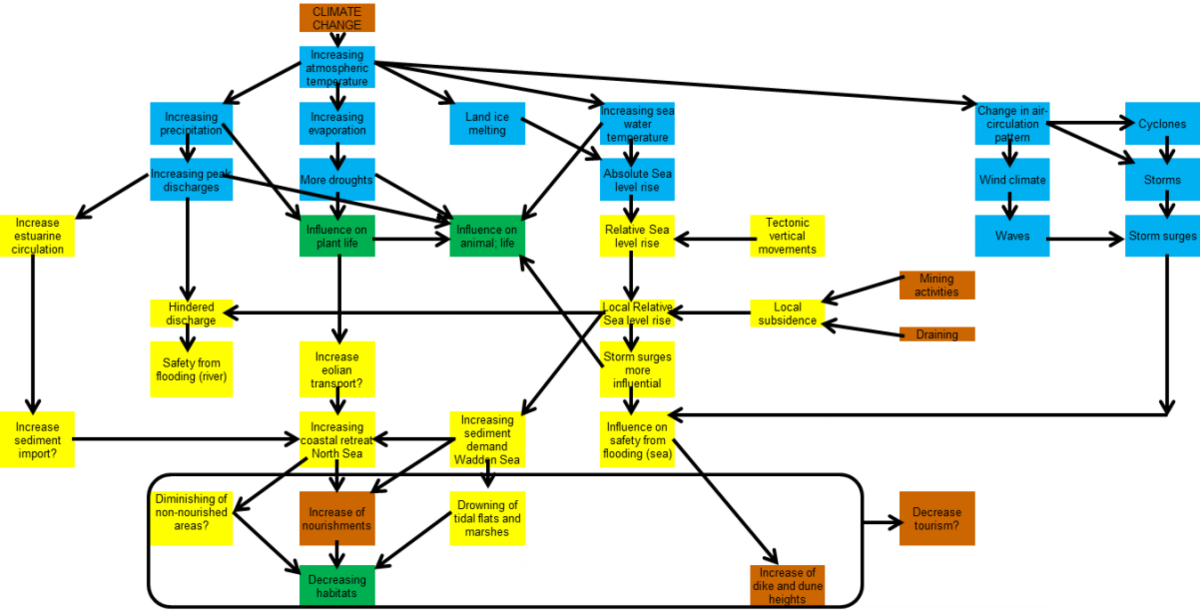 Figure 1: Sketch of the potential effects and interactions of climate change on the Wadden Sea. In brown human interventions, in blue direct climate driven changes, in yellow the reaction of the non-living nature; in green the reaction of living nature (drawn for this overview).
1.1 Local changes Wadden Sea area
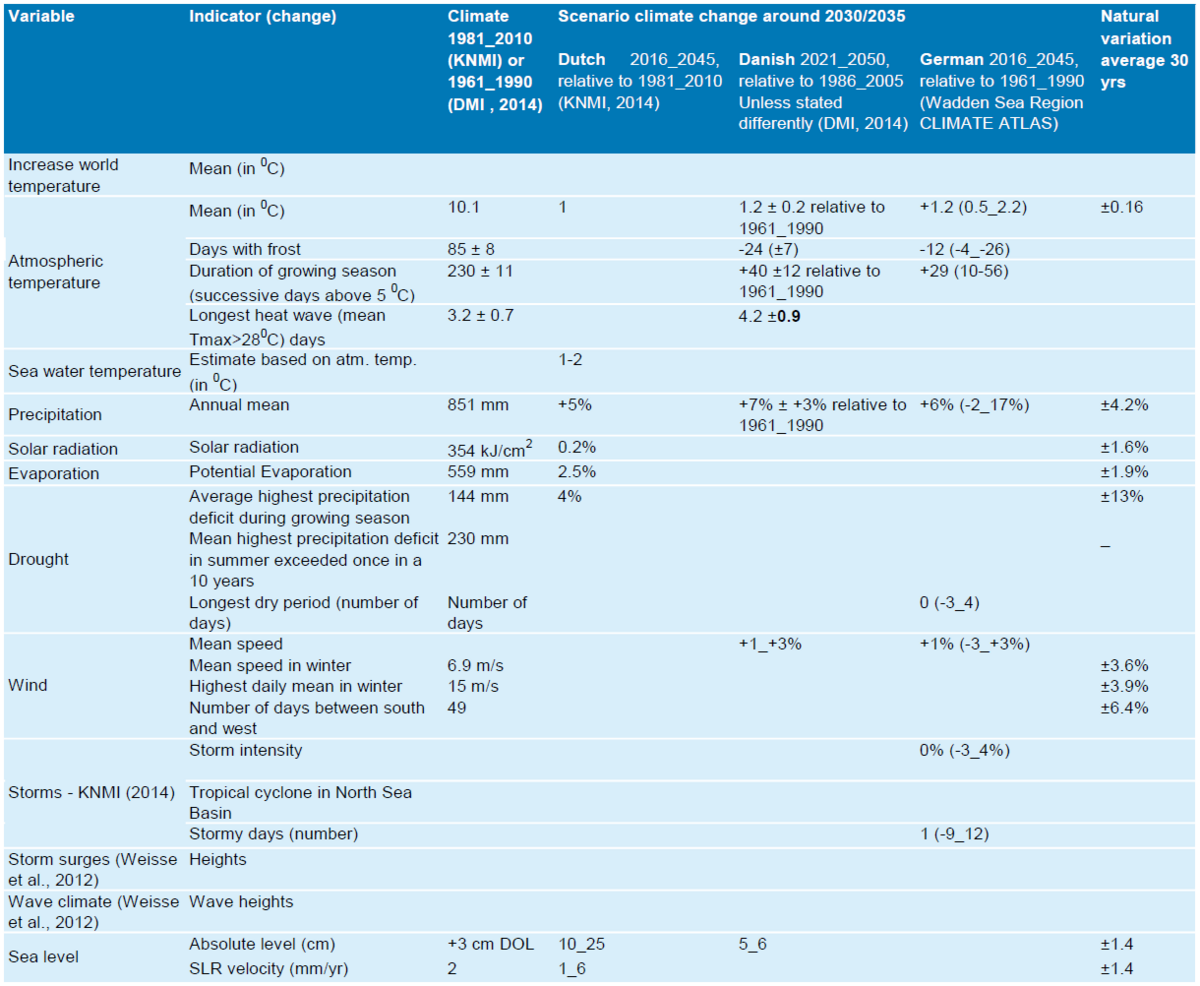
The IPCC’s AR5 projections of global climate change have been translated to local climate scenarios (for instance KNMI’14). The Danish, German and Dutch local climate scenarios differ somewhat in their ranging and use different periods of the past to compare results. For intercomparison several climate scenarios are given in Tables 1 and 2. The Royal Netherlands Meteorological Institute developed four national scenarios of climate change (Tables 1 and 2) composed of a moderate (G) and high (W) temperature increase and a changing (H) and non-changing circulation (L) pattern (Lenderink et al., 2007; KNMI, 2014). Next to that, scenarios have been constructed for sea-level rise. It can be seen that uncertainties for temperature changes are much smaller than for precipitation, wind and sea-level rise (Tables 1 and 2, compare Kabat et al., 2009, Oost et al., 2009). Furthermore, also climate scenarios were produced for the trilateral Wadden Sea www.coastalatlas.org, which are based on a concept of the Norddeutsche Klimabüro. For storm surges and wave climate the major part of the information is derived from Weisse et al. (2012). In general the various paragraphs in section 2 discuss the general pattern using the projections which give the widest range. The results were augmented with many other studies. For comparison, additional information can be found in Table 3.
Table 1. Overview projection effects of climate change for the Wadden Sea around 2030/2035.
Table 2. Overview projection effects of climate change for the Wadden Sea around 2050.
Table 3. Overview projection effects of climate change for the Wadden Sea around end of 21st century.
2. Status and trends
2.1 Air temperature change
Observed development in the Wadden Sea area
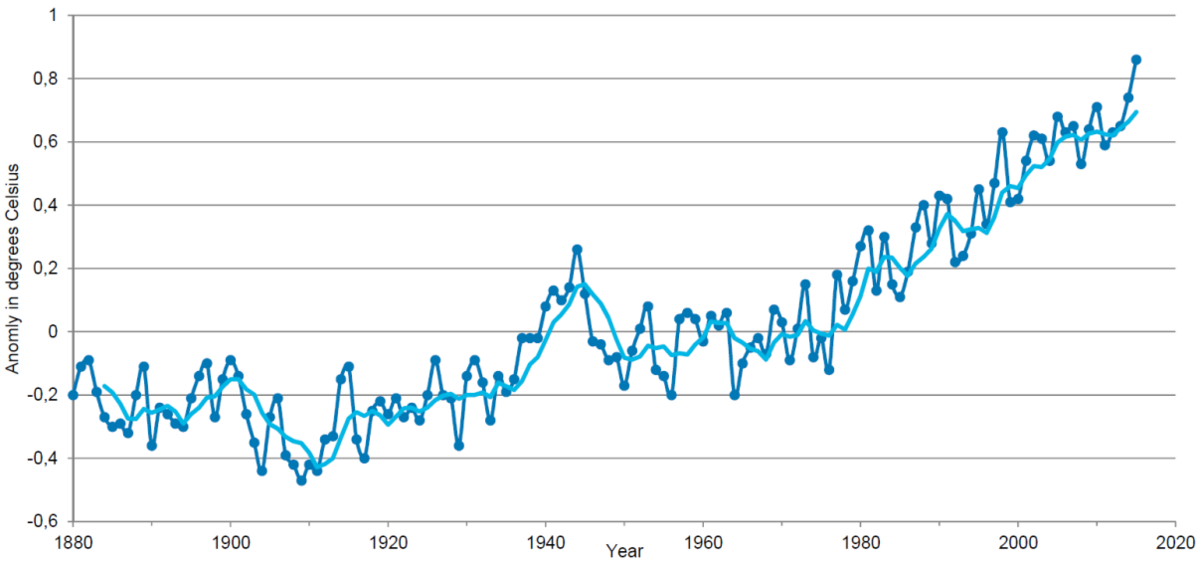
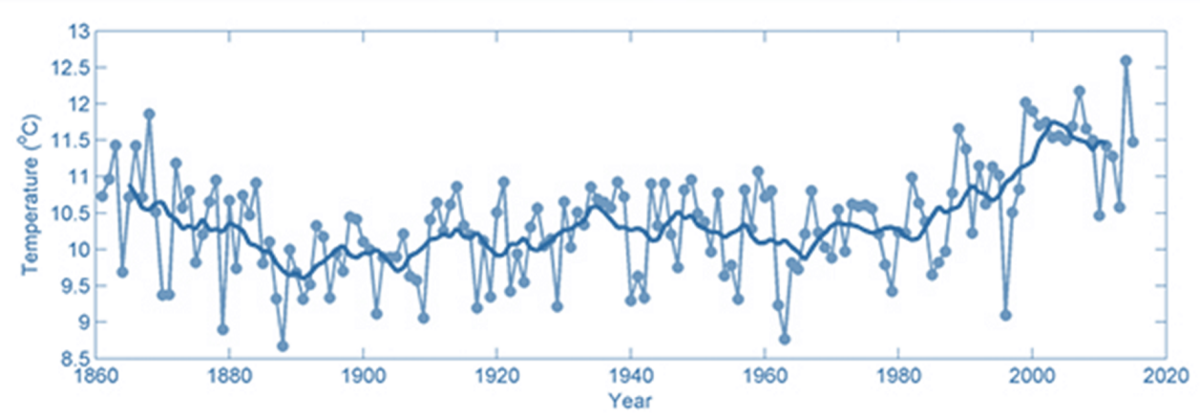
The observed temperature increase in Western Europe (including the Wadden Sea area) during the past 50 years is about twice that of the global mean increase (KNMI, 2014; Figure 2). Total temperature increase between 1901 and 2013 equals 1.8 °C of which 1.4 °C were reached between 1951 and 2013 (KNMI, 2014). The higher mean temperatures coincides with a decrease in the number of days with a minimum temperature less than 0 °C and an increase in days with a maximum temperature higher than 20 °C (Sluijter, 2008). In winter (December, January, February), more frequent westerly winds led to milder temperatures. In summer (June, July, August), an increase in solar radiation, mainly due to a reduction in air pollution, contributed to the additional warming (Van Oldenborgh et al. 2009; KNMI, 2014). Based on the Hellmann index for winter severity (Hellmann, 1917), winters after 1998 ranged between normal in the NE part of the Wadden Sea to normal - very mild in the SW part. In 2015 there was a positive phase of the ‘Atlantic Multidecadal Oscillation’ (AMO), but there are indications that this may change in the coming time to a negative phase with less rain and cooler summers (McCarthy et al., 2015), depending on the rate of climate change.
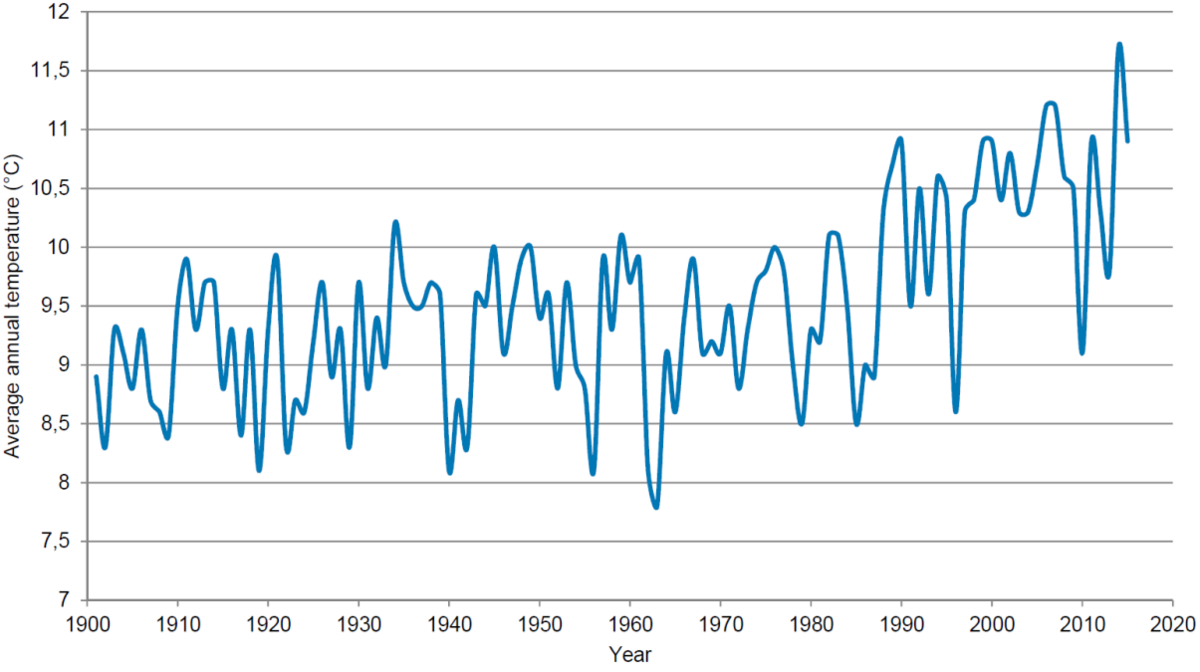 Figure 2. Average annual temperature at the Bilt, the Netherlands, since 1901 (Data: Royal Netherlands Meteorological Institute).
Projected developments Wadden Sea area
It should be realized that variations in the decadal rates of global and regional warming are not represented in the long-term projections (Scaife et al., 2015). Projections indicate an average rise of annual air temperatures of 1.0 °C and 2.3 °C by 2050, relative to the average temperature over the period 1981-2010 (KNMI, 2014). For the end of the century, yearly mean temperatures are projected to increase between 1.2 °C and 3.7 °C (DMI, 2014). Next to the annual average, the temperature of the coldest days in winter and the warmest days in summer are expected to increase (KNMI, 2014). For the end of the century (2071-2100), the number of days with frost in the Wadden area, might decrease relative to 1981-2010 by as much as 35-80 % (KNMI, 2014). An increase of extreme high temperatures (Sterl et al., 2008a) may lead to maximum temperatures above 40 °C at the end of 2100 inland in the Netherlands (Sterl et al., 2008b), but will be probably less prominent along the cooler Wadden Sea. The growing season might increase with 70 days (relative to 1986-2005, DMI, 2014).
B. Effects of rising temperatures on sea waterThere is a strong correlation of the temperature of the sea water with the sea-surface temperature of the atmosphere and partly (in winter) with the NAO index (van Aken, 2008, Figure B.I). Therefore, on a yearly basis, the temperature in the Wadden Sea region depends mainly on the dominant wind direction, but, on the long-run, mainly on global climate development (Verbeek, 2003). Since about 1980 sea-water temperature at the Marsdiep station clearly shows a warming of about 1.5 °C with 2014 being the warmest year, with an average water temperature of 12.5 °C (Nauw et al., 2016, Figure I). Sea-water temperature may increase with increasing atmospheric temperatures towards the end of the century with 1 °C-5 °C (see also: Kabat et al., 2009). The number of days with (sea-)ice will decrease strongly, especially if prevailing wind directions will shift more to the west. A possible slow-down of the warm Gulfstream may slow these warming trends (Rahmstorf et al., 2015).
|
2.2 Solar radiation, precipitation, evaporation and drought
Observed development in the Wadden Sea area
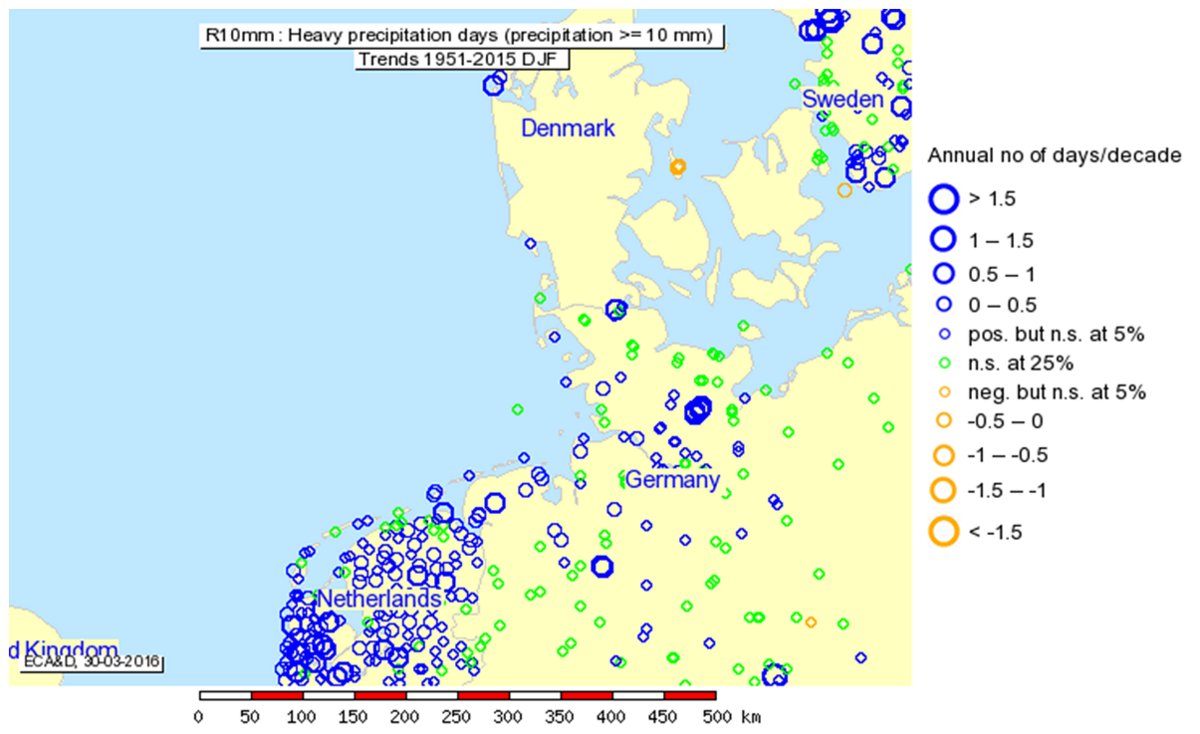
After the little Ice Age, roughly since 1825, the Wadden Sea climate has become more maritime in character. Thus, the annual precipitation increased in The Netherlands between 1910 and 2013 with 25.9 % (178.6 mm, average over 102 stations) with marked seasonal differences (KNMI, 2014). There is medium confidence that since 1950 this is partially due to a human-induced contribution (KNMI, 2014). With the exception of summer, all seasons have become wetter and days with ≥10 mm precipitation have increased along a large part of the Wadden Sea (Klok, 1998; Sluijter, 2008; KNMI, 2014, Figure 3). In the Netherlands, the intensity of precipitation in the coastal zone increases by 15 % for every degree of water-temperature increase, against 5 % for inland locations (Lenderink and Beersma, 2008; Lenderink et al., 2009, KNMI, 2014). Especially in autumn, precipitation in the Wadden Sea area is higher as compared to inland, whereas in spring inland precipitation is higher (Heijboer & Nellestijn, 2002; www.klimaatatlas.nl).
 Figure 3. Observed trends in the number of winter (top) and summer days (bottom) per year with at least 10 mm precipitation between 1951 and 2015 for the Wadden Sea area (Source: www.ecad.eu).
Potential evaporation is the evaporation occurring when there are no limitations in water supply (KNMI, 2014). The total potential evaporation (Makkink) for De Bilt in the growing season (1 April-30 September) shows on average a linear increase over the period 1958-2013 with 11.9 % (Figure 4; KNMI, 2014).
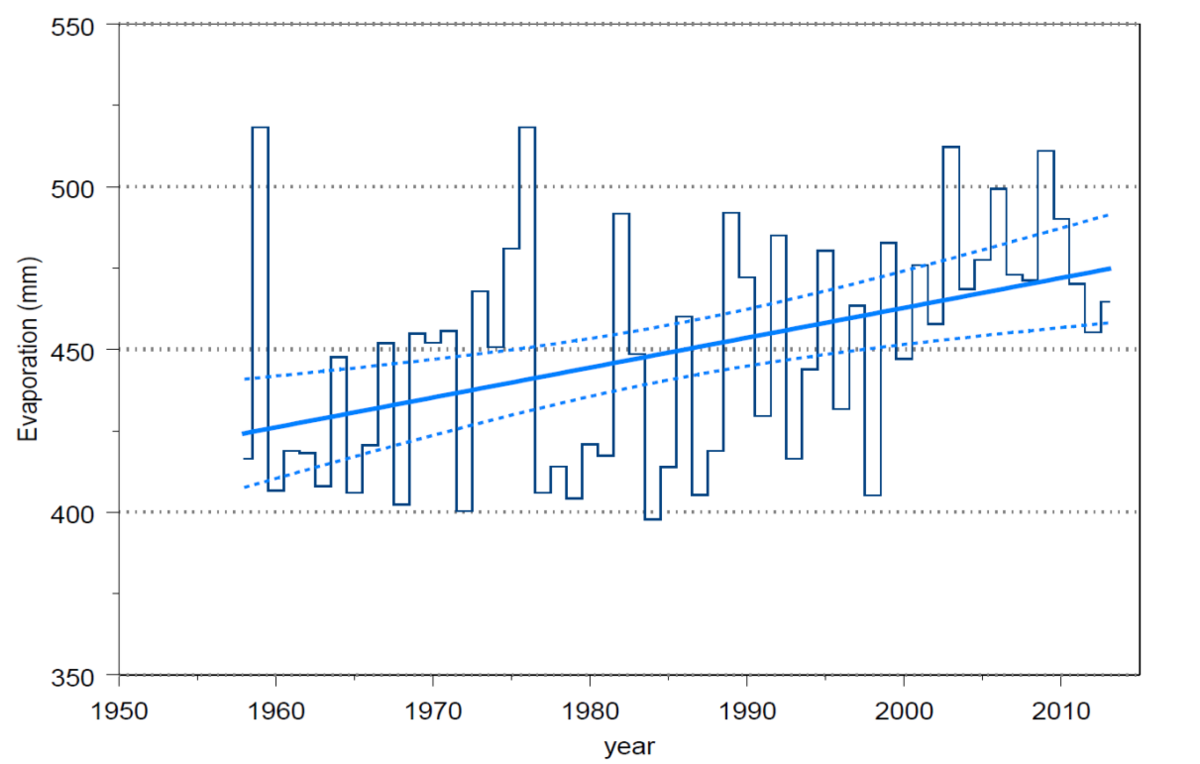 Figure 4. Sum of potential evaporation in the growing season (1 April – 30 September) for De Bilt 1958-2013. The straight line represents a linear regression fit. The dashed lines give the 95 % confidence bounds (KNMI, 2014).
The maximum precipitation deficit in the growing season (cumulative potential evaporation – precipitation) can be used as a measure for drought. In the Netherlands a small increase in drought has been observed since 1951 (see KNMI 14).
Projected developments Wadden Sea area
For the Wadden Sea most scenarios give an increase in mean precipitation, but with high uncertainties (Figure 5, KNMI, 2014). The Wadden Sea atlas (Table 2) projects a mean increase in precipitation for 2071-2100, compared to 1961-1990, of on average 9 %, but with large uncertainties (between -6 % and 31 %). The increase mainly occurs in the winter season, whereas the summer will probable become dryer. Such increases will lead to an average decrease in salinity of the Wadden Sea.
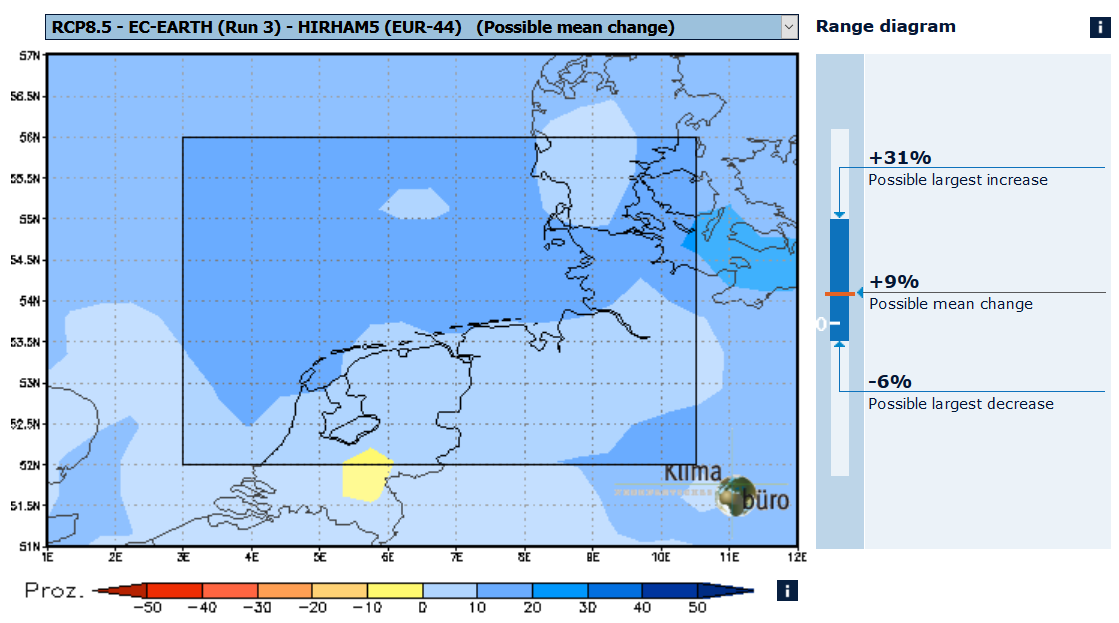 Figure 5. Wadden Sea: Possible mean change of the annual mean precipitation until the end of the 21st century (2071-2100) compared to today (1961-1990) (see coastal atlas).
KNMI (2014) scenarios indicate that the solar radiation may increase or decrease slightly in the coming century. Mean annual potential evaporation is projected to increase under all scenarios with 2.5-7 % around 2050 and 2.5-10 % around 2085 (KNMI, 2014). Precipitation deficits resulting in droughts during the growing season, given as the mean highest precipitation deficit are projected to increase by 0.7-30 % around 2050 and 1-50 % around 2085 (KNMI, 2014).
D. Global solar radiation, precipitation, evaporation and drought(Mainly copied from IPCC, 2013, 2014) Observed global developmentThe amount of water vapour in the atmosphere has increased globally since the 70s. This is consistent with the observed warming of the atmosphere, since warm air can contain more moisture (IPCC, 2013). IPCC, 2013 states: “Confidence in precipitation change averaged over global land areas since 1901 is low prior to 1951 and medium afterwards. Averaged over the mid-latitude land areas of the Northern Hemisphere, precipitation has likely increased since 1901 (medium confidence before and high confidence after 1951). For other latitudes area-averaged long-term positive or negative trends have low confidence [..]“. “There are likely more land regions where the number of heavy precipitation events has increased than where it has decreased. The frequency and intensity of heavy precipitation events has likely increased in North America and Europe”. IPCC (2013) concludes on evaporation: “On a global scale, evapotranspiration over land increased (medium confidence) from the early 1980s up to the late 1990s. After 1998, a lack of moisture availability in southern hemisphere land areas, particularly decreasing soil moisture, has acted as a constraint to further increase of global evapotranspiration”. Drought is the precipitation deficit calculated from the evaporation and precipitation. Concerning droughts IPCC (2013) concludes: “that there is not enough evidence at present to suggest more than low confidence in a global-scale observed trend in drought or dryness (lack of rainfall) since the middle of the 20th century, owing to the quantity and quality of observational data. Projected global developmentsIPCC (2013) states: “Changes in precipitation will not be uniform. The high latitudes and the equatorial Pacific are likely to experience an increase in annual mean precipitation under the RCP8.5 scenario. In many mid-latitude and subtropical dry regions, mean precipitation will likely decrease, while in many mid-latitude wet regions, mean precipitation will likely increase under the RCP8.5 scenario. Extreme precipitation events over most of the mid-latitude land masses and over wet tropical regions will very likely become more intense and more frequent”. “Annual surface evaporation is projected to increase as global temperatures rise over most of the ocean and is projected to change over land following a similar pattern as precipitation. Decreases in annual runoff are likely in parts of southern Europe, the Middle East, and southern Africa by the end of the 21st century under the RCP8.5 scenario. Increases in annual runoff are likely in the high northern latitudes corresponding to large increases in winter and spring precipitation by the end of the 21st century under the RCP8.5 scenario. Regional to global-scale projected decreases in soil moisture and increased risk of agricultural drought are likely in presently dry regions and are projected with medium confidence by the end of the 21st century under the RCP8.5 scenario”. |
2.3 Sea level
Observed development Wadden Sea area
The Mean Sea-Level Rise (MSLR) rates of 20th century in the southern North Sea show large variability (Figure 6; Hofstede, 2005; 2007; Von Storch et al., 2008; Kabat et al., 2009, Weisse et al., 2012). Dutch sea-level has been rising steadily at a rate of 1.86 ± 0.15 mm per year (± 2 σ limits; CBS, PBL, Wageningen UR, 2016) over the period 1890-2014. This is comparable to the global estimate over the overlapping period (1900-2009) of about 17 cm (Church & White, 2011). German observations are also broadly consistent with estimated global MSLR, with slightly lower rates for the East Frisian coasts and slightly higher rates for the Schleswig Holsteinian coasts (Wahl et al., 2010, 2011; Albrecht et al., 2011). Outstanding acceleration could not be inferred (e.g., Albrecht et al., 2011; Wahl et al., 2011; Weisse et al., 2012; Baart et al., 2015; CBS, PBL, Wageningen UR, 2016). The main processes for the Dutch stations that correlate with inter-annual variation (based on 125 years of data) in the Wadden tide gauges are surge (over 42-55 %), tide (3-7 %), inverse barometric effect (3-10 %) and the trend (1-2 %) (De Ronde et al., 2013). The inter-annual sea-level variations do not correlate with variations in river discharge and the North Atlantic Oscillation (see also Frederikse et al., 2015, 2016).
Projected developments Wadden Sea area
Projections of sea levels are used for maintenance, design and planning (Dilling et al., 2010). For the Netherlands, it has been advised to use statistical models for projections up to 30 years ahead (ENW 2015). For projections of 30 years and longer the use of climate models is recommended.
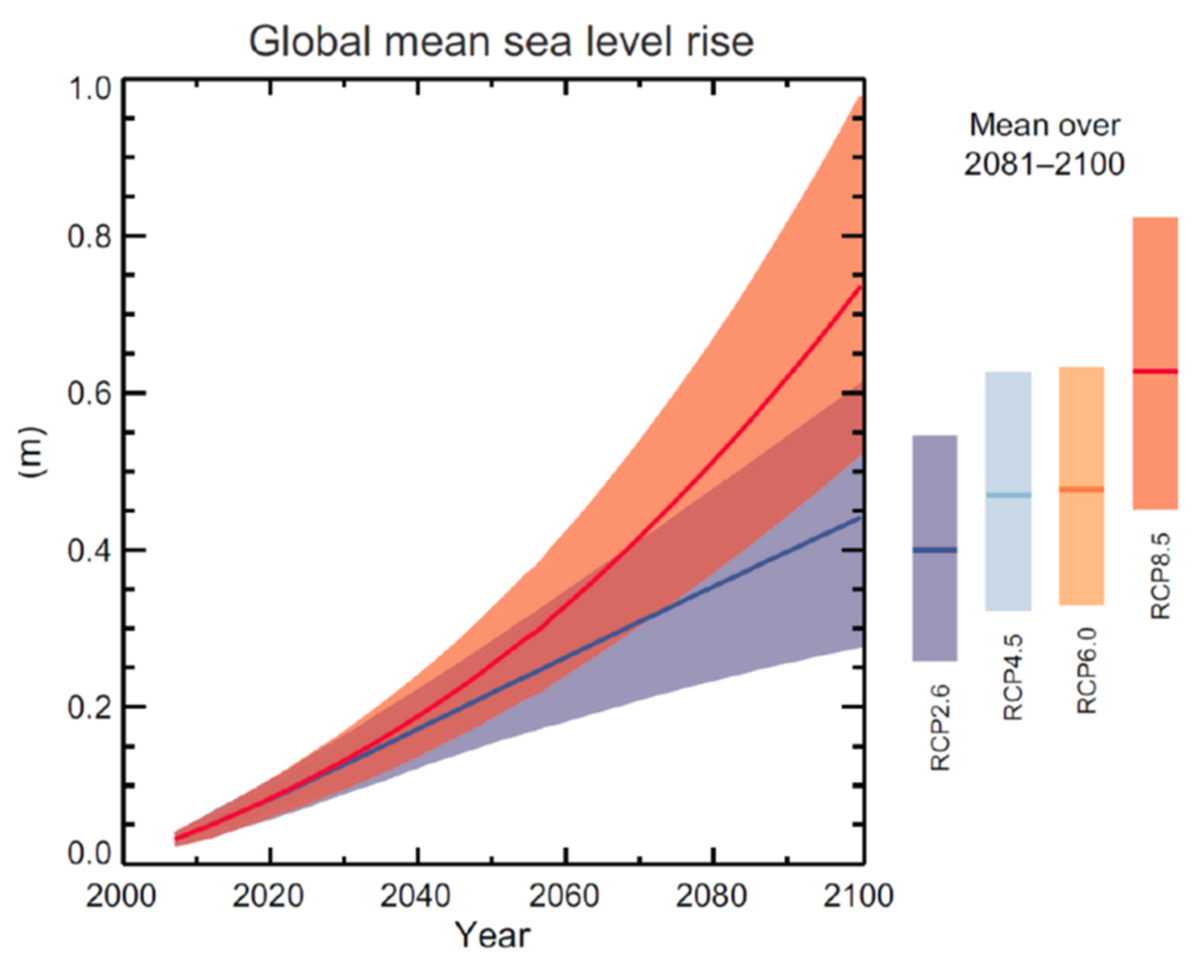
In 2014 KNMI projected sea-level developments for the North Sea basin, taking many physical processes into account (Figure 6, Table 1-3, KNMI, 2014). Most extreme projections are from DMI (2014) which predict a sea-level rise in 2071-2100 relative to 1986-2005 of 34 cm (10 to 60 cm) to 61 cm (30 to 90 cm). On top of sea-level rise subsidence due to isostasy (order 0.3 mm/ yr) and, after 1950, mining activities and water-management works (several mm/yr; Kooi et al., 1998; CPSL, 2005; Katsman et al., 2008) and peat subsidence (up to 10-20 mm/ yr) should locally be added. However, more extreme projections also exist. Katsman et al. (2011) derived estimates of 0.40-1.05 m MSLR for the coast of the Netherlands by 2100 and in excess of three times these values by 2200. In Schleswig Holstein maximum SLR-scenario for coastal maintenance and flood protection of 1.5 m up to 2100 is applied. For general management strategies maximum scenarios are 0.3 m up to 2050 and 0.8 m up to 2100.
New insights suggest that increasing temperatures due to continued high greenhouse-gas emissions over the next decades may lead to an unstoppable collapse of West-Antarctica’s glaciers (see insert). If this becomes reality, it will challenge the goals set for the Wadden Sea area especially after 2050. Although the studies should be considered as preliminary results, the implications are far-reaching and a reconnaissance study to map out the possible consequences is recommended.
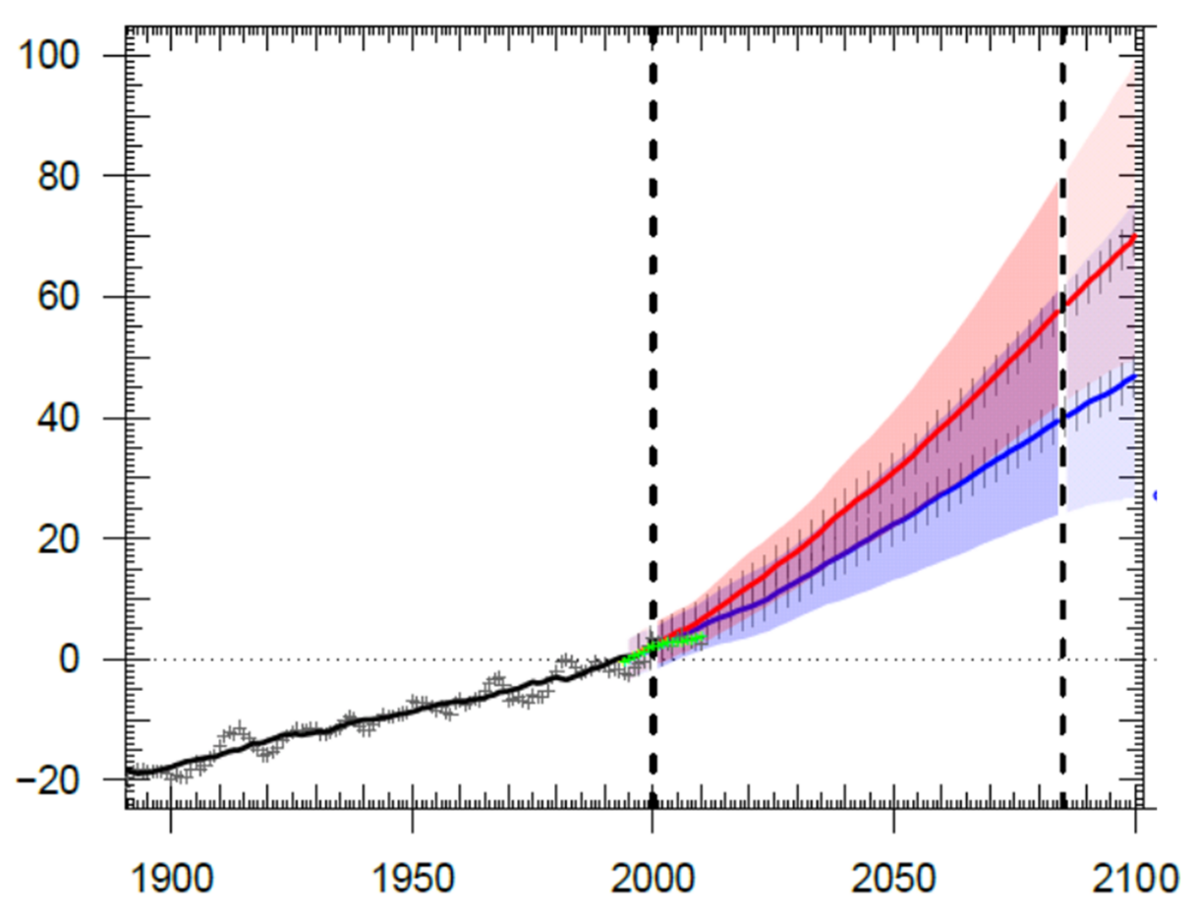 Figure 6. KNMI’14 scenarios for North Sea basin mean sea-level rise and its likely range, relative to 1986-2005 mean. Observational data consist of the average of six stations in The Netherlands. The green symbols indicate the five-year running means obtained from satellite altimetry (1993-2013) over the North Atlantic, with respect to 1993-1998 (source observations: Permanent Service for Mean Sea Level). For years before 2000 and beyond 2085 (vertical dashed line), the mean was taken over a smaller window and is therefore drawn in a different shading. Natural variability at five-year time-scale is included in the range and also shown as vertical bars. The black line denotes the 30-year running mean through the observations (1890-2009), symbols denote the five-year running means. Observational data: PSMSL database (Church & White 2011; KNMI, 2014).
E. The uncertain role of AntarcticaIt is extremely likely that the non-linear rise of GMSL in the 20th century is enhanced by greenhouse gases (IPCC, 2014; Kopp et al., 2016). Projections of maximum global average sea-level rise in 2100 were lower in AR4 (0.6 m (0.42 m to 0.8 m) for SRES A1B-scenario) then in AR5 (0.74 m (1 sigma: 0.52 m to 0.98 m for RCP8.5). Based on several approaches, other authors confirmed these values, but with larger standard deviations (Kopp et al., 2016, Mengel et al., 2016). For the first decades it is expected that climate variability will obliterate the climate change signal in MSLR, but thereafter the latter will become dominant. IPCC (2014) concludes: [..] “significant uncertainties remain, particularly related to the magnitude and rate of the ice-sheet contribution for the 21st century and beyond, the regional distribution of sea-level rise, and the regional changes in storm frequency and intensity”. And (IPCC, 2013): “The potential collapse of ice shelves, as observed on the Antarctic Peninsula (Rignot et al., 2004, Scambos et al., 2004, Rott et al., 2011), could lead to a larger 21st century rise of up to several tenths of a metre”. Up to now the IPCC projections are based on a negligible or even negative contribution of Antarctica to MSLR. New observations and modeling indicate that ice dynamics of Antarctica, and to a lesser extent Greenland, may lead to non-linear increases in sea-level rise; sometimes with a bigger and earlier contribution to GMSLR than thought in AR5 (Joughin et al., 2014; Rignot et al., 2014; Greenbaum et al, 2015; McMillan et al., 2015; Wouters et al., 2015; Jackson & Jevrejeva, 2016; Scheuchl et al., 2016; Tedesco et al., 2016). Recent studies even indicate that maximum sea-level rise by 2100 might be 1.8 m or more (Hansen et al., 2013, 2016; Jevrejeva et al., 2014; DeConto & Pollard, 2016). The models used in the above-mentioned studies have their limitations (DeConto & Pollard, 2016, Hansen et al., 2016) and the results should therefore be considered as preliminary. Currently IPCC is re-assessing the role of Antarctica for sea-level rise. An update report will appear after 2018. Although sea-level rise during the coming decades will still be small, several of the above-mentioned studies indicate that the contribution of Antarctica might be much more substantial and possibly earlier than thought in AR5 later in this century and beyond (De Conto & Pollard, 2016). This might challenge the goals set for the Wadden Sea area already during this century. A reconnaissance study to map out the possible consequences if high projections become reality is recommended. |
2.4 Wind, storms, wave conditions and storm surges
Observed development in the Wadden Sea area
Windiness (climate of mean wind), storminess (climate of high winds), wave conditions and related storm-surge conditions along the Wadden Sea have shown pronounced, highly correlated inter-annual and inter-decadal variations during the 20th century, of which the driving forces are not yet fully understood (Alexandersson et al., 2000, Wang et al., 2009, Bakker & van den Hurk, 2012; KNMI, 2014). As for wind direction: for the period 1948-2007 the share of westerly winds increased in the late winter and early spring, the number of N to NW winds is not changing (Van Oldenborgh et al., 2009). Any projected future changes ought to be considered in combination with these natural fluctuations.
Windiness, storminess and wave conditions were high at the beginning of the 20th century, decreased towards the mid-century and rose until the beginning of the 1990s, when a maximum was reached, after which they sharply declined over the North Sea by the end of the 20th century (Figure 7; Flather et al., 1998; Langenberg et al., 1999; Schmidt, 2001; Weisse et al., 2002, 2005, 2012; Matulla et al., 2007; Bakker & van den Hurk, 2012; KNMI, 2014). This is in agreement to the findings of Chang et al., (2012) for the Northern Hemisphere. There is no discernible trend over the whole period of 140 years (Weisse et al., 2012; KNMI, 2014). Analyses of a time series for the period 1843-2006 (Cuxhaven) show that extreme sea-levels have increased over more than 150 years due to mean sea-level rise with the above discussed variations superimposed (Weisse & von Storch, 2009, Weisse et al., 2012). Modelling indicates that half of the observed increase in storm surge heights along the southern and eastern coasts of the North Sea from the 1960s to the 1990s is due to natural variability of the local weather, while the other half appears to be associated with changes in large scale (mean) atmospheric conditions such as represented by the North Atlantic Oscillation (von Storch et al., 2008; Weisse et al., 2012).
 Figure 7. Annual mean geostrophic wind (as a measure of windiness) for the pressure triangle Aberdeen-Tyborøn-De Bilt, which covers the whole North Sea (Sterl et al., 2015).
Projected developments in the Wadden Sea area
Results from climate model studies suggest no statistically significant changes in long-term mean wind conditions, low wind conditions and extreme wind speeds, with natural variability being large and dominant for the century to come for the Wadden area (Chang et al., 2012, KNMI, 2014, Sterl et al., 2015). The atmospheric wind and pressure fields projections have a high degree of uncertainty resulting in high uncertainties in the projection of storm surges (e.g., 1/ 50 year storm surge height around 2100 increasing with 0-70 cm (Lowe & Gregory, 2005; Woth, 2005; Woth et al., 2006; Christensen et al., 2007; Debernhard et al., 2008; Sterl et al., 2009; for underlying causes see: Weisse et al., 2012)). Moreover, high resolution models suggest that within estuaries and narrow bays of the Wadden Sea the projected changes show a stronger climate change response then open North Sea, but with large uncertainties (Woth et al., 2006; Figure 8). Furthermore, models point to an increase in frequency of extremes coming from westerly directions (KNMI, 2014), which may result in an increase in impact on the N-S oriented coasts of the Wadden Sea and a decrease for the E-W oriented coasts. Most extreme wave heights may increase towards the end of the 21st century, especially in the German Bight, but the magnitude and the pattern of these changes are highly variable and uncertain (Weisse et al., 2012).
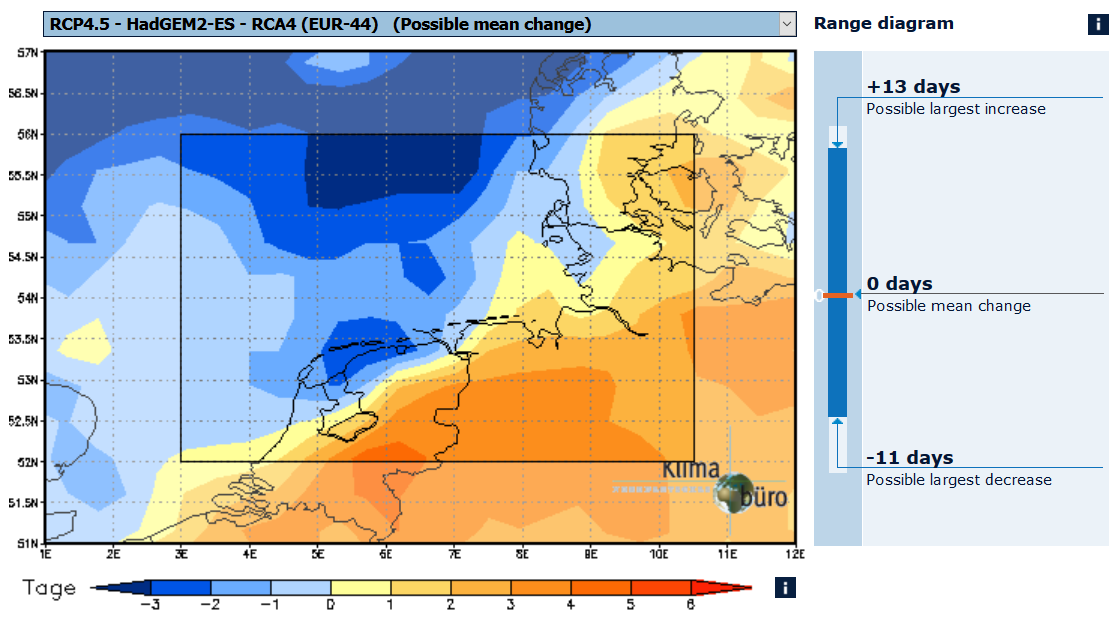 Figure 8. Possible mean change of the annual stormy days until the end of the 21st century (2071-2100), as compared to today (1961-1990) http://www.coastalatlas.org/coastalatlas/2071-2100/year/stormy-days/wadden-sea-region/mean-change.html.
High-resolution atmosphere-only model runs suggest that in a warmer climate, tropical cyclones might reach the North Sea, leading to very high wind speeds (Bf 11 and more) as early as September (KNMI, 2014). The results are still uncertain and research is on-going.
From several tide-surge model simulations it appears that as a first order approximation, changes in mean high water level and storm surge heights can be added linearly (Sterl et al., 2009; Howard & Lowe, 2010; Weisse et al., 2012), implying that for a fixed height of the land the number of storm surges flooding the area would increase considerably upon a rise in MHWL (Figure 9).
 Figure 9. Hypothetical effect of a 1 m mean high water level (MHWL) rise on the storm surge frequency for West-Terschelling. For areas with a height of +3 m Dutch Ordnance Datum, the number of storm surges reaching this level would increase by a factor of ca. 50. Note that in reality the effect might be more severe due to the increase in water depth in the North Sea.
G. Global wind, storms, wave conditions and storm surges(Mainly copied from IPCC, 2013, 2014) Observed global developmentSome reports suggest consistency between observations and projected patterns of wind climate in response to anthropogenic climate change (Wang et al., 2009). Other reports, however, concluded that observed changes are not inconsistent with natural variability (e.g., WASA-Group, 1998; Bärring & von Storch, 2004; Bengtsson et al., 2009; Weise et al., 2011). Chang & Fu (2002) found that mean storm track intensities were increased on the Northern Hemisphere by about 30 % between the late 1960s to the mid-1990s. A significant shift of the location of the North Atlantic storm track was reported (McCabe et al., 2001; Geng and Sugi, 2001; Paciorek et al., 2002; Weisse et al., 2005, 2012). IPCC (2014) states: “Based on in situ and satellite altimeter observations and wave–model hindcasts, it is likely that mean significant wave heights (SWH, defined as the average of the highest one third of wave heights) have increased in regions of the North Pacific and the North Atlantic over the past half century, and in the Southern Ocean since the mid 1980s [..]. Although anthropogenic influences have been considered (Wang et al., 2009), it is likely that reported SWH trends over the past half-century largely reflect natural variations in wind forcing". Not much information is available on storm surges on a global level. IPCC (2014) states: “It is likely that extreme sea levels (for example, as experienced in storm surges) have increased since 1970, being mainly the result of mean sea-level rise. Due to a shortage of studies and the difficulty of distinguishing any such impacts from other modifications to coastal systems, limited evidence is available on the impacts of sea-level rise”. Projected global developmentsProjections of potential future changes in extra-tropical storm climate under influence of anthropogenic climate change vary strongly and indicate relative low confidence in future changes in wind climate in Europe (Christensen et al., 2007). IPCC (2013) states “There is high confidence that the global number of extra-tropical cyclones is unlikely to decrease by more than a few percent due to anthropogenic change. There is high confidence that a small poleward shift is likely in the Southern Hemisphere storm track, but the magnitude is model-dependent. There is medium confidence that a poleward shift in the N. Pacific storm track is more likely than not and that it is unlikely that the response of the N. Atlantic storm track is a simple poleward shift. There is low confidence in the magnitude of regional storm track changes, and the impact of such changes on regional surface climate”. IPCC (2014) states: “in general there is low confidence in wave model projections because of uncertainties regarding future wind states, particularly storm geography, the limited number of model simulations used in the ensemble averages, and the different methodologies used to downscale climate model results to regional scales (Hemer et al., 2012a). Despite these uncertainties, it appears likely (medium confidence) that enhanced westerly surface winds in the S[outhern] H[emisphere] [..] will lead to enhanced wave generation in that region by the end of the 21st century". IPCC (2013) states: "In summary, dynamical and statistical methods on regional scales show that it is very likely that there will be an increase in the occurrence of future sea level extremes in some regions by 2100, with a likely increase in the early 21st century. The combined effects of MSL rise and changes in storminess will affect future extremes. There is high confidence that extremes will increase with MSL rise yet there is low confidence in region-specific projections in storminess and storm surges.” |
2.5 Human interference and climate change
The effects of human interference combined with those of climate change are operating via various pathways influencing the abiotic and biotic ecosystem, as well as human use (Figure 1). Understanding of pathways and effects is still sketchy. Much might be learned from abiotic and biotic changes brought about by the multidecadal shifts in climate during the past century (Hiscock et al., 2004; Philippart, 2007; Van Hal et al., 2011; Heip, 2011). Here follows a brief discussion of the main points.
Increasing temperatures will bring about ecological changes due to, amongst others, the survival of flora and fauna and the increasing potential growing season. The latter will probably result in a denser vegetation cover and in accelerated succession. On the other hand, an increase in the frequency and length of periods of severe drought, locally enhanced by ground water mining, may lead to a more frequent destruction of vegetation and to dune erosion. It is recommended to study the implications for island nature and coastal safety management.
Higher water temperatures and lower salinities in combination with human induced changes (fishery, invasive species) will influence the ecology of the Wadden Sea. Regime shifts, comparable to those in the North Sea in 1979 (colder water) and 1988 (warmer) (Phillippart et al., 2003; Philippart, 2007; Van Hal et al., 2011; Heip, 2011) are to be expected. Especially changes of winter temperature are thought to be quite important (Philippart et al., 2016). The implications for ecosystem management and fishery are not yet fully understood.
Sea-level rise is a problem for the morphological development, because basically the Wadden area (up to the -20 m line) is almost not receiving sand from outside: it is a closed system. The backbarrier reacts to faster SLR and to subsidence by mining (e.g., sand or gas) and closure works by importing more sediment (see report on geomorphology). All the sand needed will be derived from the North Sea coasts and ebb-tidal deltas. Erosion in combination with higher sea levels will lead to faster coastal retreat.
Due to the limitations to net sedimentation tidal flats may start to drown within this century, although resilience might be higher than previously assumed (Oost et al., 2014). Furthermore, (sand drift) dykes hinder sediment import on islands, which may lead to loss of island areas. The implications for the abiotic and biotic ecosystems in the Wadden area are not studied in sufficient detail to understand all implications.
Even when the number of storm surges would not change, their impact would increase when tidal flats, marshes and islands could not keep up with sea-level rise. Relative sea-level rise will also cause more frequent storm surge attacks on hard coastal defences, which will have to be strengthened. Furthermore, waterways, which may witness higher peak discharges, will be hindered to flow out into the sea due to sea-level rise. Pumps have to be installed and/or higher inland river-dikes should be built.
All human adaptations on their turn will also influence the Wadden Sea area: an indirect effect of climate change.
3. Recommendations
3.1 Monitoring and research
The Wadden Sea system is already affected by changes due to climate change. It is noted that there are many national climate studies and studies concentrating on the North Sea basin at large, but there are hardly any climate studies concentrating on the Wadden Sea area, the nearby mainland, the barrier islands and the North Sea shoreface. Consequently, many of the studies show differences in approach and differences in results. For a coherent approach for management of the trilateral Wadden Sea area of Denmark, Germany and the Netherlands, coherent climate (change) studies are necessary. To that end the following recommendations are given:
- Establishment of one (group) of open-access database(s) for climate and tidal data which can be approached via several portals such as WaLTER (Wadden Sea Long-Term Ecosystem Research);
- Establishment of a permanent working group of professional researchers and managers concentrating on impact of climate change on the Wadden Sea area in trilateral cooperation;
- Furthermore, it is recommended to make a reconnaissance study to map out the possible consequences of high and fast sea-level rise.
3.2 Management
Large uncertainties surround climate projections, both in terms of the carbon-dioxide scenario, the effects on climate, the local effects and the reaction of the ecosystem and the influence on human use of the Wadden. It is essential to manage the area in such a way that the measures are robust enough to perform under all (increasingly variable) weather conditions and that policies should be flexible enough to enable shifting to alternative management strategies. Within the trilateral cooperation, a trilateral climate change adaptation strategy has been developed by the trilateral working group climate. It was adopted in the Tønder Declaration (CWSS, 2014). The strategy contains seven principles and several priorities that help to implement climate change adaptation in management of the trilateral Wadden Sea area. Some major notions are:
- Lock-in situations leading to dead-end pathways should be avoided. Although this sounds rather simple, past historical policies might well have created such dead-end pathways such as urban development in the deep polders;
- Select the right method to support adaptation planning. A workable and structured set of criteria to choose research methods for specific adaptation questions is offered by the diagnostic framework proposed by Hinkel & Bisaro (2014; see: Werners et al., 2016);
- Policy makers and managers should be aware that climate change can bring about extreme changes which call for extreme measures, which might prove difficult to implement (Olsthoorn et al., 2008);
- Timely planning adequate measures, often at the moment one does not yet know whether these are needed, is a major key to success and should be seen as an insurance to climate change;
- Restoring and allowing natural processes might be one of the ways to deal with climate change effects (Löffler et al., 2011, Oost et al., 2014, Lammerts and van Haperen, 2015). Development is still in its infancy. More attention should be given to such solutions and more field pilots are needed to test their feasibility;
- In many spots natural processes are not sufficient or cannot be applied, such as river-outlets and sluices. Here, poignant choices will have to be made to either maintain the status quo by even more robust technical measures (such as pumping out fresh water instead of using the tides) or changing the status quo (such as allowing tides to move further up-river) and adapting infrastructure, housing and industry.
4. Summary
Climate is changing worldwide and also in the Wadden Sea area. Clearly visible are the increases in temperature and precipitation. It is expected that air temperature will continue to increase with 0.9 °C to 4.8 °C for the period 2071-2100 with reference to 1961-1990. Also, sea-water temperature may increase (estimate of 1 to 5 °C) over the same period. As a result, the number of days with frost will diminish considerably, whereas the growing season will lengthen by 19 to 96 days at the end of this century. Furthermore, precipitation is thought to increase, but uncertainties in the projections are large. The same holds true for wind climate and storm surges. There are some indications that more cyclones might reach the North Sea basin, but research is still ongoing. Sea-level rise is expected to accelerate, so that, by the end of the century sea-level may have risen by 10 cm to 90 cm relative to the period 1986 to 2005. New research however, suggests that due to faster melting of the Antarctic land ice, sea-level rise may increase up to 1.9 m by 2100. IPCC is expected to produce a new study on sea-level rise in 2018.
All these changes have a direct and an indirect (via ecology and human interferences) impact on the hydromorphodynamic development of each part of the Wadden area (islands, shoreface, ebb-tidal deltas and backbarrier area). Also the changes have a direct and an indirect (via hydromophology and human interferences) impact on the ecological development of each part of the Wadden area. Thirdly safety and other human use of the Wadden area might be influenced partially also due to the hydromorphological influences. These will lead to management measures in the future.
Co-operation between the three Wadden area countries on climate is still in its early stages. It is advised to establish one (group) of open-access database(s) for climate and tidal data which can be approached via several portals such as WaLTER. In addition, more cooperation between professional researchers and managers concentrating on the impact of climate change on the Wadden Sea area will be needed in the trilateral cooperation. Furthermore, it is recommended to make a reconnaissance study to understand possible consequences if high-end projections of sea-level rise become reality. It is essential to manage the area in such a way that the measures are robust enough to perform under all (increasingly) variable weather conditions and that policies should be flexible enough to enable shifting to alternative management strategies avoiding lock-in situations.
About the authorsA.P. Oost1, J. Hofstede2, R. Weisse3, F. Baart1, G. Janssen4, R. Zijlstra4 1 Deltares, Postbox 177, 2600 MH Delft, NL 2 Schleswig-Holstein Ministry for Energy Transition, Agriculture, Environment, Nature and Digitilization Division Flood Defence, Coastal Protection and Harbours V 452, Mercatorstraße 3, 24106 Kiel, DE 3 Helmholtz-Zentrum Geesthacht, Centre for Materials & Coastal Research, Max-Planck-Str. 1, 21502 Geesthacht, DE 4 Rijkswaterstaat Noord-Nederland; Postbus 2232, 3500 GE Utrecht, NL |
References
Albrecht, F., T. Wahl, J., Jensen,R.,Weisse (2011) Determining sea level change in the German Bight. Ocean Dyn. doi:10.1007/s10236-011-0462-z.
Alexandersson, H., H. Tuomenvirta, T. Schmidth & K. Iden (2000) Trends of storms in NW Europe derived from an updated pressure data set. Clim. Res., 71–73.
Baart, F., R. Leander, J. de Ronde, H. de Vries, V. Vuik, R. Nicolai (2015) Zeespiegelmonitor 2014 Rekenmethode voor huidige en toekomstige Zeespiegelstijging, Deltares report 1209426.202 44 pp.
Bakker, A. R. & B. J. M. Van den Hurk (2012) Estimation of persistence and trends in geostrophic wind speed for the assessment of wind energy yields in Northwest Europe. Clim. Dyn., 39: 767–782, doi:10.1007/s00382-011-1248-1.
Bärring, L. & H. von Storch (2004) Scandinavian storminess since about 1800. Gephys. Res. Lett. 31, L20202. doi:10.1029/2004GL020441.
Bengtsson, L., K. I. Hodges & N. Keenlyside (2009) Will extratropical storms intensify in a warmer climate? J. Clim., 22: 2276–2301.
Bindoff, N. L., et al (2007) Observations: Oceanic climate change and sea level. In: Climate Change 2007: The Physical Science Basis. Contribution of Working Group I to the Fourth Assessment Report of the Intergovernmental Panel on Climate Change [Solomon, S., D. Qin, M. Manning, Z. Chen, M. Marquis, K. B. Averyt, M. Tignor and H. L. Miller (eds.)] Cambridge University Press, Cambridge, United Kingdom and New York, NY, USA.
Chang, E. & Fu, Y. (2002) Interdecadal variations in Northern Hemisphere winter storm track intensity. J. Clim. 15, 642e658.
Chang, E. K. M., Y. Guo & X. Xia (2012) CMIP5 multimodel ensemble projection of storm track change under global warming. J. Geophys. Res. Atmospheres, 117, D23118, doi:10.1029/2012JD018578.
Christensen, J., Hewitson, B., Busuioc, A., Chen, A., Gao, X., Held, I., Jones, R., Kolli, R., Kwon, W.-T., Laprise, R., Rueda, V.M., Mearns, L., Menéndez, C., Räisänen, J., Rinke, A., Sarr, A., Whetton, P. (2007) Regional climate projections. In: Solomon, S., Qin, D., Manning, M., Chen, Z., Marquis, M., Averyt, K., Tignor, M., Miller, H. (Eds.), Climate Change 2007: The Physical Science Basis. Contribution of Working Group I to the Fourth Assessment Report of the Intergovernmental Panel on Climate Change. Cambridge University Press, Cambridge, United Kingdom and New York, NY, USA.;
Church, J., J. Gregory, P. Huybrechts, M. Kuhn, K. Lambeck, M. Nhuan, D. Qin & P. Woodworth (2001) Changes in sea level. In: Houghton, J., Ding, Y., Griggs, D., Noguer, M., van der Linden, P., Dai, X., Maskell, K., Johnson, C. (Eds.), Climate 66 R. Weisse et al. / Ocean & Coastal Management 68 (2012) 58-68 Change 2001: Working Group I: The scientific basis. Cambridge University Press, Cambridge, United Kingdom and New York, NY, USA. pp. 639–693.
Church, J., N. White, T. Aarup, W. Wilson, P. Woodworth, C. Domingues, J. Hunter & K. Lambeck (2008) Understanding global sea levels: past, present and future. Sustain. Sci. 3, 9e22. doi:10.1007/s11625-008-0042-4.
Church, J. & N. White (2011) Sea-level rise from the late 19th to the early 21st century. Surv. Geophys.. doi:10.1007/s10712-011-9119-1.
Church, J. A. et al (2011) Revisiting the Earth’s sea-level and energy budgets from 1961 to 2008. Geophys. Res. Lett., 38: L18601.
Church, J. A., D. Monselesan, J. M. Gregory & B. Marzeion (2013) Evaluating the ability of process based models to project sealevel change. Environ. Res. Lett., 8:014051.
CWSS (2014) Toender Declaration. Ministerial Council Declaration of the 12th Trilateral Governmental Conference on the Protection of the Wadden Sea. Common Wadden Sea Secretariat, Wilhelmshaven, Germany.
Clark, P.U., J.D. Shakun, S.A. Marcott, A.C. Mix, M.E. Scott Kulp, A. Levermann, G.A Milne, P.L. Pfister, P.D. Santer, D.P. Schrag, S. Solomon, T.F. Stocker, B.H. Strauss, A.J. Weaver, R. Winkelmann, R. Archer, E. Bard, A. Goldner, K. Lambeck, R.T. Pierrehumbert & G.-K. Plattner (2016) Consequences of twenty-first-century policy for multi-millennial climate and sea-level change. Nature Climate Change 6: 360–369, doi:10.1038/nclimate2923.
CPSL (2005; CPSL 2005. Coastal Protection and Sea Level Rise. Solutions for Sustainable Coastal Protection in the Wadden Sea Region. Wadden Sea Ecosystem No. 21. Common Wadden Sea Secretariat. Wilhelmshaven, Germany.
Debernhard, J. & L. Roed (2008) Future wind, wave and storm surge climate in the Northern Seas: a revist. Tellus A 60, 427e438. doi:10.1111/ j.1600e0870.2008.00312.x.
DeConto, R.M. & D. Pollard (2016) Contribution of Antarctica to past and future sea-level rise. Nature, 531:591-597.
de Ronde, J., F. Baart, C. Katsman & V. Vuik (2013) Zeespiegelmonitor. Tech. Rep. 1208712– 000, Deltares, HKV en KNMI.
Dillingh, D., B. Fedor & J. de Ronde (2010) Definitie zeespiegelstijging voor bepaling suppletiebehoefte. Tech. Rep. 1201993–002, Deltares.
DMI (2014) (M. Olesen, K. Skovgaard Madsen, C. Ankjær Ludwigsen, F. Boberg, T. Christensen, J. Cappelen, O. Bøssing Christensen, K. Krogh Andersen, J. Hesselbjerg Christensen). Fremtidige klimaforandringer i Danmark. Danmarks Klimacenter rapport nr. 6 , 31 pp.
ENW (2015) Advies rapporten zeespiegelmonitor, Nummer: ENW-15-23
Flather, R.A., J.A. Smith,. J.D. Richards, C. Bell & D.L. Blackman (1998) Direct estimates of extreme storm surge elevations from a 40-year numerical model simulation and from observations. Global Athmos. Oc. System 6: 165-176.
Frederikse, T., R.E.M. Riva, D.C. Slobbe & D.B.T. Broerse (2015) Time-varying trends in regional sea level from tide gauge data' European Geosciences Union general assembly 2015, Vienna, Austria, 12/04/15 - 17/04/15, pp. 1-1.
Frederikse, T., R. Riva, M. Kleinherenbrink, Y. Wada, M. van den Broeke & B. Marzeion (2016) Closing the sea level budget on a regional scale: Trends and variability on the Northwestern European continental shelf. Geophys. Res. Lett., 43, no. 20, 10864-10872, doi:10.1002/2016GL070750.
Geng, Q. & Sugi (2001) Variability of the North Atlantic cyclone activity in winter analyzed from NCEP-NCAR reanalysis data. J. Clim. 14: 3863e3873.
Greenbaum, J. S., D.D. Blankenship, D. A. Young, T. G. Richter, J.L. Roberts, A.R.A. Aitken, B. Legresy, D.M. Schroeder, R.C. Warner, T.D. van Ommen & M.J. Siegert (2015) Ocean access to a cavity beneath Totten Glacier in East Antarctica, Nat. Geosci., 8:294–298.
Gregory, J. M. et al (2012) Twentieth-century global-mean sea-level rise: Is the whole greater than the sum of the parts? J. Clim., doi:10.1175/JCLI-D-12-00319.1.
Hansen, J., P. Kharecha, M. Sato, V. Masson-Delmotte, F. Ackerman, D. Beerling, P.J. Hearty, O. Hoegh-Guldberg, S.-L. Hsu, C. Parmesan, J. Rockstrom, E.J.Rohling, J. Sachs, P. Smith, K. Steffen, L. Van Susteren, K. von Schuckmann & J.C. Zachos (2013) Assessing “dangerous climate change”: Required reduction of carbon emissions to protect young people, future generations and nature, PLOS ONE, 8, e81648, doi:10.1371/journal.pone.0081648.
Hansen, J., M. Sato, P. Hearty, R. Ruedy, M. Kelley, V. Masson-Delmotte, G. Russell, G. Tselioudis, J. Cao, E. Rignot, I. Velicogna, B. Tormey, B. Donovan, E. Kandiano, K. von Schuckmann, P. Kharecha, A.N. Legrande, M. Bauer & K.W. Lo (2016) Ice melt, sea level rise and superstorms: evidence from paleoclimate data, climate modeling, and modern observations that 2 °C global warming could be dangerous. Atmos. Chem. Phys., 16, 3761-3812, http://www.atmos-chem-phys.net/16/3761/2016/ doi:10.5194/acp-16-3761-2016
Heijboer, D. & J. Nellestijn (2002) Klimaatatlas van Nederland; de Normaalperiode 1971-2000. Uitgeverij Elmar B.V., Rijswijk, 182 pp.Hellmann, G. 1917. Überstrenge Winter. AbhandlungenderKöniglich Preussische Akademie der Wissenschaften. Reichsdruckerei, Berlin.
Heip, C (2011) Climate change and marine ecosystem research, synthesis of European research on the effects of climate change on marine environments. CLAMER deliverable nr. 1.2.
Hemer, M. A., J. Katzfey, & C. Trenham (2012) Global dynamical projections of surface ocean wave climate for a future high greenhouse gas emission scenario. Ocean Model., 70: 221-245.
Hiscock, K., A. Southward, I. Tittley & S. Hawkins (2004) Effects of changing temperature on benthic marine life in Britain and Ireland. Aquatic Conservation: Marine and Freshwater Ecosystems 14 (4): 333-362.
Hofstede, J (2005) Danish-German-Dutch Wadden Environments. In: E.A. Koster (Ed.), The physical geography of Western Europ. Oxford University Press, Oxford, 185-205.
Hofstede, J.L.A. (2007) Entwicklung des Meeresspiegels und der Sturmfluten: ist der anthropogene Klimawandel bereits sichtbar? Coastline Reports, 9: 139 – 148.
Howard, T. & Lowe, J. (2010) Interpreting century-scale changes in southern North Sea storm surge climate derived from coupled model simulations. J. Clim. 23, 6234-6247. doi:10.1175/2010JCLI3520.1.
IPCC (2013) Climate Change 2013: The Physical Science Basis. Contribution of Working Group I to the Fifth Assessment Report of the Intergovernmental Panel on Climate Change [Stocker, T.F., D. Qin, G.-K. Plattner, M. Tignor, S.K. Allen, J. Boschung, A. Nauels, Y. Xia, V. Bex & P.M. Midgley (eds.)]. Cambridge University Press, Cambridge, United Kingdom and New York, NY, USA, 1535 pp.
IPCC (2014) Climate Change 2014: Synthesis Report. Contribution of Working Groups I, II and III to the Fifth Assessment Report of the Intergovernmental Panel on Climate Change [Core Writing Team, R.K. Pachauri and L.A. Meyer (eds.)]. IPCC, Geneva, Switzerland, 151 pp.
Jackson, L.P. & S. Jevrejeva (2016) A probabilistic approach to 21st century regional sea-level projections using RCP and High-end scenarios. Global and Planetary Change 146:179–189.
Jevrejeva, S., A. Grinsted, J. C. Moore, and S. Holgate (2006) Nonlinear trends and multiyear cycles in sea level records. J. Geophys. Res. Oceans, 111, C09012.
Jevrejeva, S., J. C. Moore, A. Grinsted & P. L. Woodworth (2008) Recent global sea level acceleration started over 200 years ago? Geophys. Res. Lett., 35: L08715.
Jevrejeva, S., A. Grinsted & J.C. Moore (2014) Upper limit for sea level projections by 2100. Environ. Res. Lett. 9 104008 9pp, doi:10.1088/1748-9326/9/10/104008.
Joughin, I., B.E. Smith & B. Medley (2014) Marine ice sheet collapse potentially under way for the Thwaites Glacier Basin, West Antarctica. Science 344(6185):735–738.
Kabat, P., C.M.J. Jacobs, R.W.A. Hutjes, W. Hazeleger, M. Engelmoer, J.P.M. Witte, R. Roggema, E.J. Lammerts, J. Bessembinder, P. Hoekstra & M. van den Berg (2009a) Klimaatverandering en het Waddengebied, position paper Klimaat en Water, WaddenAcademie, 85 pp.
Katsman, C.A., J. Church, R. Knopp, D. Kroon, M. Oppenheimer, H.-P. Plag, S. Rahmstorf, J. Ridley, H. von Storch, D.G. Vaughan & R. van de Wal (2008a) Bovengrensprojecties voor lokale zeespiegelstijging aan de Nederlandse kust voor 2100 en 2200. In: P. Vellinga, C. Katsman, A. Sterl & J. Beersma (Eds.), Onderzoek naar bovengrensscenario’s voor klimaatverandering voor overstromingsbescherming van Nederland: een internationale wetenschappelijke beoordeling (2008a (De Nederlandse vertaling). KNMI, de Bilt, en Wageningen UR, Wageningen, 20-100.
Katsman, C. A., A. Sterl, J.J. Beersma, H.W. van den Brink, W. Hazeleger, R.E. Kopp, D. Kroon, J. Kwadijk, R. Lammersen, J. Lowe, M. Oppenheimer, H.-P. Plag, J. Ridley, H. von Storch, D.G. Vaughan, P. Vellinga, L.L.A.. Vermeersen, R.S.W. Wal & R. Weisse (2011) Exploring high-end scenarios for local sea-level rise to develop flood protection strategies for a low-lying delta—the Netherlands as an example. Clim. Change, 109: 617–645, doi:10.1007/s10584-011-0037-5.
Klok, E.J. (1998) Indices die de variabiliteit en de extremen van het klimaat beschrijven. Klimatol Dienstverl KNMI, De Bilt. Technical report TR-211, 50 pp.
KNMI (2014) KNMI’14: Climate Change scenarios for the 21st Century – A Netherlands perspective; by Bart van den Hurk, Peter Siegmund, Albert Klein Tank (Eds), Jisk Attema, Alexander Bakker, Jules Beersma, Janette Bessembinder, Reinout Boers, Theo Brandsma, Henk van den Brink, Sybren Drijfhout, Henk Eskes, Rein Haarsma, Wilco Hazeleger, Rudmer Jilderda, Caroline Katsman, Geert Lenderink, Jessica Loriaux, Erik van Meijgaard, Twan van Noije, Geert Jan van Oldenborgh, Frank Selten, Pier Siebesma, Andreas Sterl, Hylke de Vries, Michiel van Weele, Renske de Winter & Gerd-Jan van Zadelhoff. Scientific Report WR2014-01, KNMI, De Bilt, The Netherlands. www.climatescenarios.nl
Kooi, H., Johnston, P. Lambeck, K. Smither, C. & R. Molendijk (1998) Geological causes of recent (100 yr) vertical land movement in the Netherlands, Tectonophysics, 299: 297 – 316.
Kopp, R.E., A.C. Kemp, K. Bittermann, B.P. Horton, J.P. Donnelly, W.R. Gehrels, C.C. Hay, J.X. Mitorvicak, E.D. Morrow & S. Rahmstorf (2016) Temperature-driven global sea-level variability in the Common Era. PNAS E1434–E1441
Lammerts, E.J. & A. Van Haperen (2015) De Natuur van de Kust, tussen aangroei en afslag, Uitgave Vereniging van Bos- en Natuurterreineigenaren VBNE, ISBN 978-90-820436-8-6, 91 pp.
Langenberg, H., A. Pfizenmay, H. von Storch & J. Föndermann (1999) Storm-related sea level variations along the North Sea coast: Natural variability and anthropogenic change. Continental Shelf Res. 19: 821-842.
Lenderink G., A.P. van Ulden, B.J.J.M. van den Hurk, & F. Keller (2007) Climate scenarios of temperature and precipitation for the Netherlands: a study on combining global and regional climate model results. Clim.Dyn, 29: 157-176.
Lenderink, G. & J. Beersma (2008) Neerslag en droogte. In: De toestand van het klimaat in Nederland 2008. KNMI, De Bilt, 24-33.
Lenderink, G., E. van Meijgaard & F. Selten (2009) Intense coastal rainfall in the Netherlands in response to high sea surface temperatures: analysis of the event of August 2006 from the perspective of a changing climate. Clim. Dyn., 32:19-33.
Löffler, M.A.M., C.C. de Leeuw, M.E. ten Haaf, S.K. Verbeek, A.P. Oost, A.P. Grootjans, E.J. Lammerts & R.M.K. Haring (2011) Back to Basics. Edition of: Het Tij Geleerd Waddenvereniging, SBB, Natuurmonumenten, Rijkswaterstaat, It Fryske Gea, ru-Groningen, Radboud Universiteit Nijmegen, RU-Utrecht. 44 pp.
Lowe, J., Gregory, J. (2005) The effects of climate change on storm surges around the United Kingdom. Phil. Trans. R. Soc. A 363, 1313e1328. doi:10.1098/rsta.2005.1570
Matulla, C., W. Schöner, H. Alexandersson, H. von Storch & X.L. Wang (2007) European storminess_ late nineteenth century to present. Climate Dynamics, DOI 10.1007/s00382-007-0333-y.
McCabe, G., M. Clark & M. Serreze (2001) Trends in Northern Hemisphere surface cyclone frequency and intensity. J. Clim. 14 (12): 2763e2768
McCarthy, G.D., I.D. Haigh, J.J. –M. Hirschi, J.P. Grist & D.A. Smeed (2015) Ocean impact on decadal Atlantic climate variability revealed by sea-level observations. Nature 521: 508–510 DOI 10.1038/nature14491
McMillan, M., A. Shepherd, A. Sundal, K. Briggs, A. Muir, A. Ridout, A. Hogg & D. Wingham (2015) Increased ice losses from Antarctica detected by CryoSat-2. Geophysical Research Letters 10.1002/2014GL060111
Mengel, M., A. Levermann, K. Frieler, A. Robinson, B. Marzeion & R. Winkelmann (2016) Future sea level rise constrained by observations and long-term commitment. PNAS, 113(10): 2597–2602, doi: 10.1073/pnas.1500515113.
Nauw, J.J., Philippart, C.J.M., Duran Matute, M. & Gerkema, T. (2017) Estimates of exposure times in the Wadden Sea: A comparison of methods. Journal of Sea Research, 127:12-25.
Olsthoorn, X.. P. van der Werff, L.M. Bouwer &D. Huitema (2008) Neo-Atlantis: The Netherlands under a 5-m sea-level rise. Climatic Change 91:103–122 DOI 10.1007/s10584-008-9423-z
Oost, A., P. Kabat, A. Wiersma, J. Hofstede (2009) Climate change. In: Marencic, H., De Vlas, J. (Eds.), Thematic Report No. 4.1. Quality Status Report 2009. Wadden Sea Ecosystem, vol. 25. Common Wadden Sea Secretariat, Trilateral Monitoring and Assessment Group, Wilhelmshaven, Germany.
Oost, A.P., P. Hoekstra, A. Wiersma, B. Flemming, E.J. Lammerts, M. Pejrup, J. Hofstede, B. van der Valk, P. Kiden, J. Bartholdy, M.W. van der Berg, P.C. Vos, S. de Vries, Z.B. Wang (2012) Barrier island management: Lessons from the past and directions for the future, Ocean & Coastal Management 68, 18-38, Doi: 10.1016/j.ocecoaman.2012.07.010.
Oost, A.P., Z.B. Wang, A.V. de Groot, L.A. van Duren & L. van der Valk (2014) Preparing for climate change: a research framework on the sediment-sharing systems of the Dutch, German and Danish Wadden Sea for the development of an adaptive strategy for flood safety. Rapport No. 1209152-000, 47 pp.
Paciorek, C. J., J. S. Risbey, V. Ventura & R. D. Rosen (2002) Multiple indices of Northern Hemisphere cyclone activity, winters 1949–99. J. Clim., 15: 1573–1590.
Philippart, C.J.M., H.M. van Aken, J.J. Beukema, O.G. Bos, G.C. Cadée & R. Dekker (2003) Climate-related changes in recruitment of the bi-valve Macoma balthica. Limnol. Oceanogr. 48(6) :2171–2185.
Philippart, C.J.M. (ed.) (2007) Impacts of climate change on the European marine and coastal environment, ecosystems approach. European Science Foundation, Position paper 9.
Rahmstorf, S., J. Box, G. Feulner, M. Mann, A. Robinson, S. Rutherford & E. Schaffernicht (2105) Evidence for an exceptional 20th-Century slowdown in Atlantic Ocean overturning Nature Climate Change, Volume: 5, 475–480, DOI: 10.1038/nclimate2554.
Rignot, E., G. Casassa, P. Gogineni, W. Krabill, A. Rivera & R. Thomas (2004) Accelerated ice discharge from the Antarctic Peninsula following the collapse of Larsen B ice shelf. Geophys. Res. Lett., 31: L18401
Rignot, E., J. Mouginot, M. Morlighem, H. Seroussi & B. Scheuchl (2014) Widespread, rapid grounding line retreat of Pine Island, Thwaites, Smith, and Kohler glaciers, West Antarctica, from 1992 to 2011. Geophys. Res. Lett., 41: 3502–3509.
Rott, H., F. Muller, T. Nagler & D. Floricioiu (2011) The imbalance of glaciers after disintegration of Larsen-B ice shelf, Antarctic Peninsula. Cryosphere, 5: 125–134.
Scaife, A. R. Allan, S. Belcher, A. Brookshaw, M. Davey, R. Eade, C. Folland, M. Gordon, L. Hermanson, S. Ineson, J. Kennedy, J. Knight, J. Slingo & D. Smith (2015) Big Changes Underway in the Climate System? Met Office report, 21 pp.
Scambos, T. A., J. A. Bohlander, C. A. Shuman, & P. Skvarca (2004) Glacier acceleration and thinning after ice shelf collapse in the Larsen B embayment, Antarctica. Geophys. Res. Lett., 31: L18402.
Scheuchl, B., J. Mouginot, E. Rignot, M. Morlighem & A. Khazendar (2016) Grounding line retreat of Pope, Smith, and Kohler Glaciers, West Antarctica, measured with Sentinel-1a radar interferometry data. Geophysical Research Letters (2016; 43 (16): 8572 DOI: 10.1002/2016GL069287
Schmidt, H (2001) Die Entwicklung der Sturmhäufigkeit in der Deutschen Bucht zwischen 1879 und 2000. Klimastatusbericht 2001, Deutscher Wetterdienst, Offenbach/Main, 199-205.
Sluijter, R. (2008) Opnieuw vijf warme jaren in Nederland. In: De toestand van het klimaat in Nederland 2008. KNMI, De Bilt, 6-15.
Sterl, A., C. Severijns, H. Dijkstra, W. Hazeleger, G.J. van Oldenborgh, M. van den Broeke, G. Burgers, B. van den Hurk, P.J. van Leeuwen & P. van Velthoven (2008a) When can we expect extremely high surface temperatures? Geophys. Res. Lett., 35: L14703, doi:10.1029/2008GL034071.
Sterl, A., G.J. van Oldenborgh, W. Hazeleger & H. Dijkstra (2008b) Extreme maximumtemperaturen in de toekomst. Meteorologica, 17 (3), 4-7.
Sterl, A., H. van den Brink, H. de Vries, R. Haarsma & E. van Meijgaard (2009) An ensemble study of extreme storm surge related water levels in the North Sea in a changing climate. Ocean Sci. 5: 369e378.
Sterl, A., Bakker, A.M.R.,van den Brink, H.W. Haarsma, R., Stepek, A. Wijnant, I.L. & R.C. de Winter (2015) Large-scale winds in the southern North Sea region: the wind part of the KNMI’14 climate change scenarios. Environ. Res. Lett. 10: 035004 doi:10.1088/1748-9326/10/3/035004
Tedesco, M., T. More, X. Fettweis, E. Hanna, J. Jeyaratnam, J.F. Booth, R. Datta & K. Briggs (2016) Arctic cut-off high drives the poleward shift of the new Greenland melting record. Nature Communications 7, 11723, doi:10.1038/nscomms11723
van Aken, H.M. (2008) Variability of the water temperature in the western Wadden Sea on tidal to centennial time scales. Journal of Sea Research, 60: 227-234.
van Oldenborgh G. J., S. Drijfhout, A. van Ulden, R. Haarsma, A. Sterl, C. Severijns, W. Hazeleger, & H. Dijkstra (2009) Climate of the Past Western Europe is warming much faster than expected, Clim. Past, 5: 1–12 (2009.
Vellinga, P., C.A. Katsman, A. Sterl & J.J. Beersma, (eds.) (2008) Onderzoek naar bovengrensscenario’s voor klimaatverandering voor overstromingsbescherming van Nederland: een internationale wetenschappelijke beoordeling. (De Nederlandse vertaling). KNMI, De Bilt and Wageningen UR, Wageningen. 178 pp.
Verbeek, K. (2003) De toestand van het klimaat in Nederland 2003. KNMI, De Bilt.
von Storch, H., Gönnert, G., Meine, M.,Woth, K. (2008a) Storm surges e an option for Hamburg, Germany, to mitigate expected future aggravation of risk. Environ. Sci. and Policy. doi:10.1016/j.envsci.2008.08.003.
Wahl, T., J. Jensen, T., Frank (2010) On analysing sea level rise in the German Bight since 1844. Nat. Hazards 10:171-179. doi:10.5194/nhess-10-171-2010.
Wahl, T., J. Jensen, T., Frank, I. Haigh (2011) Improved estimates of mean sea level changes in the German Bight over the last 166 years. Ocean Dyn.. doi:10.1007/s10236-011-0383-x.
Wang, X., F. Zwiers, V. Swail & Y. Feng (2009) Trends and variability of storminess in the Northeast Atlantic region, 1874–2007. Clim. Dyn., 33:1179–1195, doi:10.1007/s00382-008-0504-5.
WASA-Group (1998) Changing waves and storms in the Northeast Atlantic? Bull. Am. Meteorol. Soc. 79, 741e760.
Weisse, R., H. Fönther & F. Feser (2002) A 40-year high-resolution wind and wave hindcast for the Southern North Sea. Proc. 7th Internat Workshop on Wave Hindcasting and Forecasting, Banff, Canada: 97-104.
Weisse, R., H. von Storch & F. Feser (2005) Northeast Atlantic and North Sea storminess as simulated by a regional climate model during 1958e2001 and comparison with observations. J. Clim. 18, 465-479. doi:10.1175/JCLIe3281.1.
Weisse, R. & H. von Storch (2009) Marine Climate and Climate Change: Storms, Wind Waves and Storm Surges. Springer-Verlag, Berlin Heidelberg New York, ISBN 978-3-540-25316-7.
Weisse, R., H. D. Niemeyer & H. Knaack (2012) Changing North Sea storm surge climate: An increasing hazard? Ocean Coast. Manage., 68:58–68, doi:10.1016/j.ocecoaman.2011.09.005.
Woth, K. (2005) North Sea storm surge statistics based on projections in a warmer climate: how important are the driving GCM and the chosen emission scenario? Geophys. Res. Lett. 32: L22708. doi:10.1029/2005GL023762.
Woth, K., Weisse, R. & H. von Storch (2006) Climate change and North Sea storm surge extremes: an ensemble study of storm surge extremes expected in a changed climate projected by four different regional climate models. Ocean Dyn. 56: 3e15. doi:10.1007/s10236e005e0024e3. online 2005.
Wouters, B., A. Martin-Español, V. Helm, T. Flament, J.M. Van Wessem, S.R.M. Ligtenberg, M.R. Van Den Broeke & J.L. Bamber (2015) Dynamic thinning of glaciers on the Southern Antarctic Peninsula. Science, DOI: 10.1126/science.aaa5727
This report should be cited as: Oost, A. P., Hofstede, J., Weisse, R., Baart, F., Janssen, G., & Zijlstra, R. (2017). Wadden Sea Quality Status Report: Climate Change. Common Wadden Sea Secretariat. https://doi.org/10.5281/zenodo.15130584
All 2017 reports may be cited collectively as: Kloepper, S., Baptist, M. J., Bostelmann, A., Busch, J.A., Buschbaum, C., Gutow, L., Janssen, G., Jensen, K., Jørgensen, H.P., de Jong, F., Lüerßen, G., Schwarzer, K., Strempel, R., & Thieltges, D. (2017). Wadden Sea Quality Status Report. Common Wadden Sea Secretariat, Wilhelmshaven, Germany. Downloaded DD.MM.YYYY. qsr.waddensea-worldheritage.org

